- Benjamin Hansen, 2015 Punishment And Deterrence: Evidence From Drunk Driving American Economic Review
- 1. Introduction
- 1.1 Drunk Driving
- 1.2 Data and Different Methods
- 2. Part 1: Replication
- 2.1 Regression discontinuity
- 3. Part 2: Critique and extension
- 3.1 Punishment and Recidivism
- 4. Main Instruction
- 4.1 Incapacitation
- 4.2 Specific Deterrence
- 4.3 Rehabilitation
Benjamin Hansen, 2015 Punishment And Deterrence: Evidence From Drunk Driving American Economic Review
1. Introduction
1.1 Drunk Driving
Drunk driving has emerged as the most serious health issue for the public after the enormous introduction of different automobiles. In all the efforts taken to combat the effects of drunk driving, the states had introduced serious laws reading the criminal offense under DUI. The different identification is often very difficult initially since the police officer depends mainly on the various field-associated sobriety tests or their often-essential own experiences. But in the year 1956, devices like breathalysers were created and then established the objective of an accurate process of calculating the BAC in absolute non-invasive ways. The cost associated with it is relatively low and the main aim is to take the burden off the police so that the driver is under alcohol consumption influence.
1.2 Data and Different Methods
Many of the criminals committed the same crime again after a few years released from prison. For this fact, criminologists as well as economists are much alike and would have also long studied various determinants of certain recidivism by the addition of the entire rates in the various criminal activities (Johnson, 2020). The different estimated relief to the punishment-based severity along with the various criminal activity usually range from the negative to the null and then to positive and hence would arise for various reasons. For example, more severe based conditions and prison time would be having high criminology-based effects mainly by the peer effects and the depreciation-based rates of the corresponding human capital.
2. Part 1: Replication
2.1 Regression discontinuity
For the regression discontinuity-based approaches delivering the usual consistent estimated consideration should be met. However, in brief, these assumptions would be implying the different observables as well as unobservable that are expected to become unchanged mainly above the threshold and along with some treatment-based status and by the treatment of altered probability rely on recidivism (Raskolnikov, 2020).
Question 1
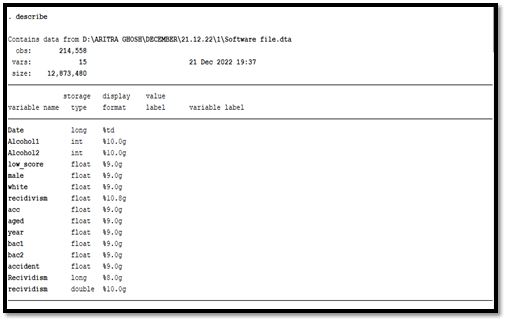
Figure 1: Dataset Overview
The above image in Figure 1 has been about dataset loading in software. The dataset has been represented from taking suggestions from the software. The software helped in having a proper investigation on all possible tools as well as the proper presentation of the dataset. The dataset had all the numerical values as the well as other data in the software file as per the requirement.
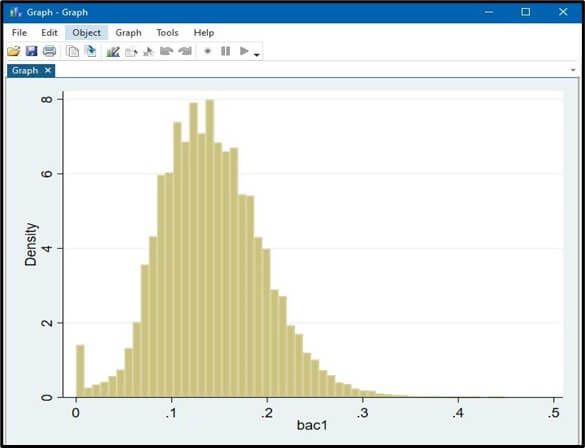
Figure 2: Discrete variables histograms of BAC1
But with the given slope that permits changes mainly at the discontinuity by equation. The primary results are basically based on the important local linear-based regression of the discontinuity with the design of the rectangular-based kernel and hence during designing, the sensitivity of different results has been tested to find the significant difference by applying the linear model along with the various kernels and some higher based order of the polynomials.
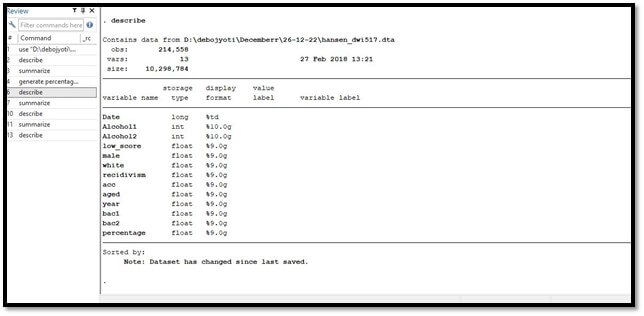
Figure 3: Adding Variable

Figure 4: Adding in Do File
In this figure variables considered for the analysis have been presented. It can be seen that out of several variables, ‘recidivism’, ‘age’ and ‘low-score’ have been considered.
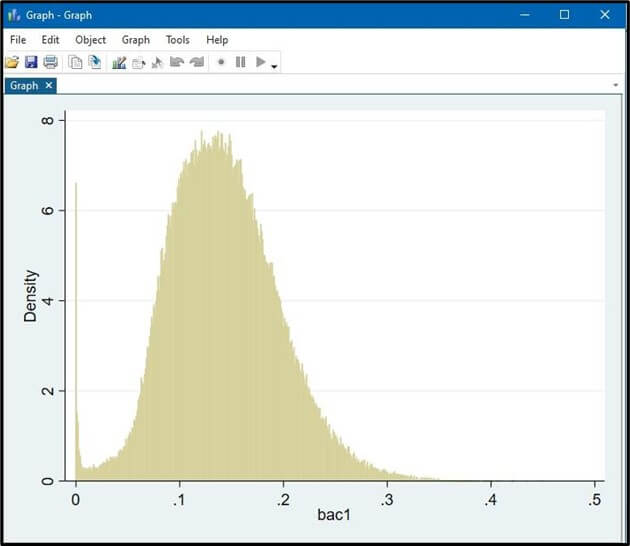
Figure 5: Continuous histograms of BAC1
But at the similar time, the state is trying to lower the exact BAC-based level which is needed for DUI and also many of the states have also instituted the “Aggravated DUIs” along with some more punishment provided to the individual associated with BAC, particularly at the extremely harmful levels (Stringer, 2019). But as of now, 42 of 50 states maintain the increased or aggravated-based DUI-linked penalties mainly for the BAC generally above a certain threshold level such as ranging from 0.15-0.20. However, many of the states also maintain “Implied consent” based laws that would stipulate that few refuse to adopt the BAC test and must be punished whoever would be found guilty over the drunken driving case.
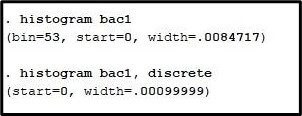
Figure 6: Bin, Start, and width of histogram BAC1
Stata based Testing is a systematic functionality to observing the behavioural transformations to modelling the attribute.
Question 2
From the regression-based models, users utilize the various local or linear regression-based discontinuity-associated designs mainly for the estimation of the influences of providing the BAC basically above DUI and its aggravated DUI-based threshold, particularly. The punishment or sanctions for various drunk-based drinking would be lacking the many challenges usually present basically in the testing of the several deterrent-based punishment effects (Sloan, 2020). There has been no average jump in the values of the bac1 variable in software.
Question 3
The AV plot as shown in the above figure suggesting on the correlation between the dependent factor recidivism(X-axis) and predictor accident(Y-axis). It can be seen that; AV plot is explain on linear corelation between the two factors. A simple linear corelation only suggest that there will be no significant change in recidivism behaviour in terms of witnessing accident incident.
Question 4
In the regression discontinuity-based models, a variety of observations is usually clustered mainly at their finest bin to which the BAC is to be measured and it's 0.001. This would capture the many potentialities of the autocorrelation present among the individuals that have identical levels of BAC. This stands for errors would be also adjusted usually for the heteroscedasticity which would be significant since this regression-based model is basically linear of the probability of models and due to this nature, the discrete-based nature of the recidivism has occurred by the construction of the heteroscedasticity. The R square value from this regression model can be seen as 0.0017 against the degree of freedom 2, 214,555. Therefore, the statistical significance of the regression model is explaining that only predictor low-scored age should be influencing only 1.7% of the changes within dependent factor recidivism. Therefore, in this regression model Prob>F or p value is 0.0000< p0.05, thus F (2, 214555) = 187.89, p = .0000, there is statistical significance between the predicting factor and response variable. In such a case, regression model applied to predict the recidivism aspects through the predicting factor low score aged.
There are numerous reasons why the assumption is more likely to be reasonable. The very first level of the accuracy by which BAC is usually recorded in the WA state, particularly as 3 digits present on the scale range from 0-1(Francesconi & James, 2021). The fact that the donut hole may not be a very good idea as the analysis could be about regression techniques only.
The bandwidth modification has not been very easy at all in the following platform as the key insights have not been very easily available in the interface. One may require a donut regression in the software platform as the analysis of data can be well presented as per the requirements provided. Stata can help in analysing the view button in Stata software for ultimately making an overview of the results.
Question 5
The plot could be perfectly presented from having a proper display of the desired results. Local polynomials can help in presenting the regression analysis as well as the proper presentation of outcomes. Local polynomials can help in better investigation of the results compared to donut whole regression.
Question 6
The linear based regression has to analyse in the bases of result-based analysis. The linear based regression is optimized in the bases of the recidivism and finally the total result is reflected, the proper representation is analysis throughout the outcomes compared to the donut-based regression. Here, the regression model is suggesting that Prob>F value 0.000 is lower than the threshold P value 0.05. Similarly, R squared value is 0.0013. Therefore, at Prob>F 0.0000< p0.05, F (1, 214556) = 284.26, p = .0000, there is significant difference between the predicting and response variable. Therefore, it can be said that, predicting factor has only influenced 1.3% changes in the response factor.
The box plot functionality is used in the base of the scatter-based command in the bases of the listing of the variables to plot the graphical implementation. The distribution of the different data points is suggesting the relationship in an integrated way of software packaging to provide the data-based manipulation to visualize the statistical automation.Here the range of the plot is calculated between 100 and 200. The Alcohol1 variable is utilized to configure the box plot.
Looking for top-notch online assignment help in the UK? Look no further than Native Assignment Help. With our dedicated team of experts, we offer comprehensive assistance tailored to your academic needs, ensuring excellence in every assignment.
3. Part 2: Critique and extension
The third essential factor is that the personal kind of breathalyzers is viable to the individual mainly to purchase and utilizes some portable-based technology that is more distant and volatile to the officials of breathalysers that are used to make access the guilt. The fourth is even by the breathalyzers-based measuring of the BAC along with some high precision degree and randomness would be occurring particularly in the measurement of the BAC. The various correlation among the two important measures is 0.99 and the difference of averages has been usually taken as 0.0008 but with certain ranges if different from -0.003 -0.004. Thus utilize the minimum of the given two variables mainly as some running-based variables to determine the DUI and aggravated-based DUI.
3.1 Punishment and Recidivism
The report generally states its effect of having the BAC mainly over a DUI-based threshold for every driver, like those having some previous test and those who do not have prior test experience. This estimate is also presented along with or without the various additional controls that could consist of the indicators many for gender, age, yearly fixed effects, and proper offense. Panel A would include the various estimates along with the bandwidth of value 0.05 but panel B would be presenting the estimate which is derived along with a little bandwidth of around 0.25 but both of them use the rectangular-based kernel usually for the weighting.
This is more critical to have a BAC and it is above 0.08 related thresholds to decrease the recidivism around 2 percentages of points mainly during the essential four-year follow-up kind window and statistically become significant, particularly at 1% level.
The issues of the bandwidth selection is significantly explored in the analysis and for each possible kind of bandwidth range from 0.005 to 0,068, the corresponding influence of having some BAC mainly above DUI and or aggravated based DUI thresholds that must be presented along the 95% of the usual confidence interval (Fell, 2019).
The controls are then significantly utilized mainly in each of the regressions as well as the rectangular-based kernel that is often used for the weighting. Thus the various point estimates are generally relative to the stability above all the bandwidths and that is except for the smaller bandwidths which are more often at least 0.02. Therefore, these estimates are particularly significant for at least 95% based levels. Thus the stability of the present estimate taken across the different bandwidths would be suggesting the linear-based specification would be a kind of relational choice mainly for the modelling of those effects of the BAC relies on Recidivism.
4. Main Instruction
4.1 Incapacitation
It is provided that the license of suspension, as well as the revocation, is the basic sanction related to the given two BAC limits. On the other hand, the learners would explore the recidivism-based windows on a granular basis and then address the various fundamental-based issues. The first step is to allow the detailed associated inspection corresponding to the effects of the punishment about the hazard of reoffending. The second step is to provide particular evidence on the previous estimate that would concern the effectiveness of such punishment is driven by the high changes in the behaviour of your and more short-run based changes mainly done to various incapacitations.
4.2 Specific Deterrence
This method is offering the method for assessing different deterrent-based effects of the DUI-associated punishment and its sanction provides that most of the statutory kind of punishment would be enhanced along with every offense. The provision gives equal weight age to every sanction but on average the future punishment could be increased by around 97% and it is completely based on the midpoint relevant measures of some percentage changes.
The drunk driver if making their drinking decision is often based on a decision but in the beckerian manner, then it would describe the deterrence of the elasticity for -0.22. The BAC of over 0.15 values of thresholds could be increased by the recent punishment as well as the sanctions and not occurring the effect on the various statutory-based sanctions. Hence, the corresponding reduction in recidivism must be consistent with what those criminologists would call the usual “specific deterrence” and its deterrent influence on the punishment that is received.
4.3 Rehabilitation
The other essential change which may reduce future drinking-based driving is rehabilitation. It should be ensured that multiple sanctions that are imposed by the court associated with alcohol consumption are enhanced at 0.08 of the threshold, which includes the victim's based panel-making and alcohol-related abuse assessment after receiving the particular alcohol treatment.
Thus, the various requirements may be significantly reducing drunk driving only by the reduction of the future consumption of toxic alcohol and then altering the various preferences with beliefs of the different drunk drivers that ensure the cause to consider the several costs of drunken driving (Raskolnikov, 2019).
For further testing to check if the alcohol-based abuse is going to shift towards threshold 1 and estimates if the future based incidents of various domestic- violence, such as assaults with several different crimes by which specific suspects are tested mainly for the related alcohol reduction at the value of 0.08 and also 0.5 threshold value. The results are not providing certain strong evidence such as other different crimes would be decreased mainly in the relativity of the responses for having the BAC over the 0.08 and 0.15 thresholds.
Conclusion
The abuse of alcohol is growing as a major public health issue, particularly in the US. This study presents evidence that is concerned generally about the various effectiveness of the punishments as well as a sanction as deterrents to recidivism among drunken drivers and finds out evidence that having the BAC above 0.08 and Dui based threshold both the short as well as long terms above 0.15. Aggravated DUI are usually associated with various recidivism reductions, particularly in the BAC. These estimates would be implying the deterrence of the elasticity is about -0.23 and also the specific deterrence comes about as high as -0.12. The NTSB often suggested more fatalities would be occurring nearly by 500-800; roughly 800 critical fatalities happen on a per year basis provided the BAC ranges from 0.05-0.07. There are various policies along with the BAC mainly to lower the limit of BAC.


