Comprehensive Overview of Accounting, Data Science, and Business Intelligence
Native Assignment Help provides assignment help to assist students in research, writing and proofreading process.
Introduction: The Users and Functions of Accounting Information in Business
Week 1
Accounting of a company refers to the systematic analysis, reporting and recording of the transaction of finance. The accountant is in charge of accountancy and they abide by some regulations and rules.
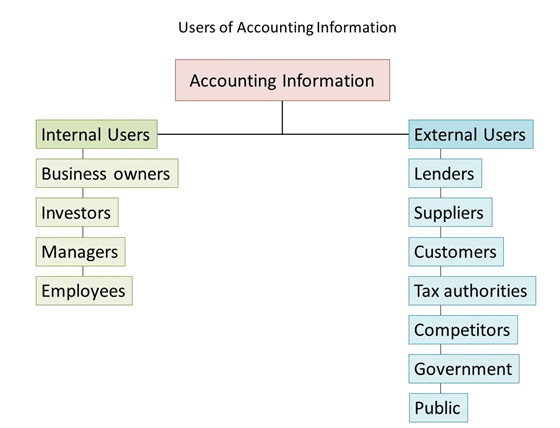
Figure 1: Users of Accounting Information
Accounting helps to understand the business’s financial performance by looking at the information and statistics and that as gross and net profit and many more. Accounting is divided into two types such as financial and management accounting. Balance sheet and profit and loss of a business measure the financial working and position of the organisation. Accounting information is used by various people in different ways such as the shareholder of a company through this information accounting helps them to recognise the position of their investment (Jarah and Almatarneh, 2021). They understand in case their holding shares are good or bad investments. The owner or the manager of an organisation uses the accounting information to realise what business plan with they go further (Nugroho, 2019). Government utilise this to calculate the tax amount a company must pay.
Data science refers to an interdisciplinary field, concentrated on the system and process taking out insight or knowledge from the data. Data science is the collection of huge unmanageable data and after that, it is altered into a more stable form of data. Data scientists are the expert who analyses the data. Data science is utilised to solve the problems that are related to business through the techniques of data-driven. It decreases the cost and rises the profit of a company and it also upgrades the efficiency of the company. Different toolboxes are used by the data scientist and are data preparation, data visualization and text analytics. Data preparation is a procedure where raw data are converted into other formats (Pistorius et al. 2020). After changing the format it can be used or processed very easily. Data visualisation is the presentation of data. Here the data are presented in graphical or pictorial for effortless analysis. Text analytics is the complete procedure of data that are unstructured. Through the examination of unstructured data, any person can get the chief insight into a business.
Week 2
Organisation refers to the people’s social unit that manages and is structured for meeting the requirement or for pursuing a communal aim. The Cambridge dictionary defines an organisation as a people’s group who do their job in an organised method for a common purpose. The reason behind the existence of an organisation is that a people’s group who are working together are able to accomplish more work than a number of individuals and it also decreases the cost and increases the efficiency. The organisation is made of five components and that is the strategic apex, middle line, technostructure, operating core and support staff. The organisation are divided into three types such as public sector, private sector and non-profitable organisations. The public sectors are fully or partly governed by the government and their main goal is not making a profit. The private sector is owned by a private individual and the chief aim is profit-making (Arieliet al. 2020). Non- profitable organisations aim for profit making and examples are societies, clubs and charity organisations.
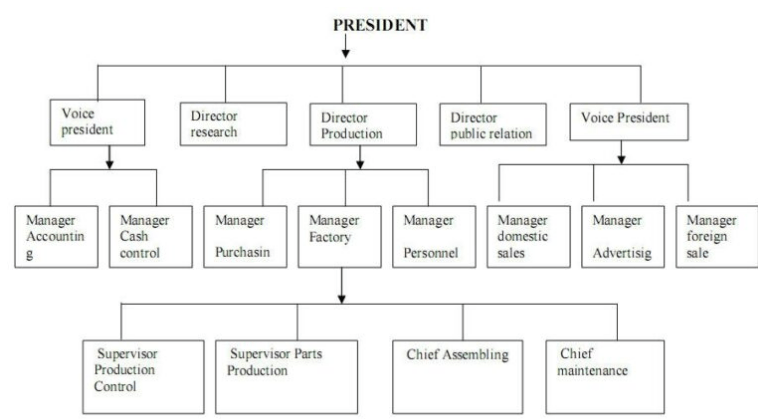
Figure 2: An organisational structure
An organisational structure is a relationship in the middle of the functions or components and the position within the company. It helps to communicate among the components of the organisation. Two types of organisational structures are observed, that is tall and flat organisational structures. The tall organisational structure obeys the layout of the pyramid and here every employee is the subordinate of others and this goes up to the CEO (Pedersen et al. 2018). The structure of a flat organisation’s management level is very small and this is normally seen in tiny organisations, sometimes big organisations adopt this structure.
Organisation data are of three types Descriptive Statistics, Comparative Statistical Analytics and Modeling Analytics. Descriptive statistics gathered data about organisational processes and calculations are needed and that permit comparison of data and eyeball. Comparative statistical analytics is used to differentiate between the data and changes in data can be identified through this (Mikalef and Krogstie, 2020). Modelling analytics is the company’s tendency for identifying chances and leveraging historic data once it's agreeable, consuming and explaining Comparative statistical analytics. It also aids in predicting the upcoming through hypothetical alteration.
Week 3
Data is the facts collected and they are represented through numbers. It can be quantitative or qualitative variables and qualitative data are descriptive in nature and quantitative is discrete in nature. Variables are unknown values and they can change at any time and a constant is the opposite of it (Andrews et al. 2019). There are eight types of variables and that is continuous, dependent, independent, categorical, discrete, measurement, nominal and ordinal variable. The sequence is an order’s list of things, normally numbers and it can be finite and infinite and uses a set. The notion is the list of elements that are separated by a comma and covered with brackets. On the other hand, the rule is the method to find every term’s value. Various mathematical rules are applied in different sequences. Geometric sequence derives every term by multiplying the last term by a constant and it can be written as {a, ar, ar2, ar3, ... }. The rule of this is Rule is “xn = ar(n-1)”.
The triangular number’s sequence is created from the dots’ pattern that generates a triangle. The rule for this is xn = n(n+1)/2 (Zhou et al. 2019). The partial sum is the summation of the part of a sequence but the summation of the infinite sequence is familiar as a series. Central tendency is the middle value of more than one number. Mean or average is the computation of adding value to a value's number and then dividing the net values’ number. The median is the values listing for picking the central value and finding this can facilitate good decision-making on suitable action. Mode’s value generally occurs in a dataset. In case someone used 2 modes then it is called bimodal, and 3 models are called multimodal (Gaunt and Merkle, 2021). The outliers are those values that are present outside the other values in a particular dataset. These values create an impact on the mean value of a dataset. Mean deviation describes the range of every value that is to the centre of a population. Variance narrates the differentiation between the sample and the average population and it is a standard deviation calculation step.
Week 4
The general logical function that is available in Excel. The functions of excel are to perform actions and this is proceeded by the ‘=’ symbol (Radu et al. 2021). This function gathers the data and processes it and the data type is processed by excel. Most of the time data have arrived in excel files or csv and through excel basic or complex manipulation can be done on the dataset. Some common function of excel is AND, FALSE, NOT, OR, IF, IFERROR and TRUE. IF is the ubber general comparison function and its statement can be used up to 64. SUMIF and COUNTIF are the two useful forms of IF and SUMIF is utilised for the summation of the values to particular range criteria whereas COUNTIF is used for counting in particular range criteria. IFERROR helps to check the error in a formula and it is very useful in case the problem is the division by Zero (Bernard et al. 2018). AND, NOT, OR and XOR are the logical function and TRUE, FALSE, 1, 0, white or black are the boolean functions of excel.
Data visualisation is used to process a huge quantity of data and complex information in the picture. Visualisation is a quick way for conveying concepts in a universal way and many scenarios can be presented by utilising this technique through small replacements and adjustments of data (Waskom, 2021). Data visualisation can easily identify the places that are required to improve and clear influences of factors over particular behaviour. It understands the products’ placement and can make upcoming predictions in sales volumes and many more. The values of a dataset can be easily compared by the various graphs and charts such as columns, bars, lines, bullets and many more. Charts are generally used for showing the composition and it can be pie, area, stacked bar, waterfall and stacked column. Scatter plot, line, bar and column chart are utilised for the understanding of the distribution of data (Healy, 2018). Line, dual-axis line and column are utilised in trend analysis. Dataset relationship is a crucial step in the analysis and relationships can be observed by bubble, line and scatter plot chat.
Week 5
Data are the gathering of facts and these can be represented by words, measurements, numbers and things descriptions and observations. Organisations collected the data and this is their backbone for taking a decision (Alexander et al. 2020). These decisions are taken after gathering and analysing the organisational data. The qualitative data are descriptive and the quantitative data are discrete. Quantitative data generally use numbers and it can take values of every type within a particular range, here the range is not fixed (Duong et al. 2018). The procedure of data to cation has several analytic steps and that starts with, descriptive analytics, inquisitive analytics, predictive analytics, prescriptive analytics and pre-emptive analytics.
Data analysis is good when questions are asked and querying the right question helps in the mining of accurate data, managing and manipulating huge datasets and generating easier insight. The preparation of data is the most important step in the analysis of data for any kind of significant analysis (Hamilton and Sodeman, 2020). The preparation of data includes several processes and that is, data profiling, data cleaning and data quality management. CrowdFlower has done a survey on the activity of the data analysis. Among the total time of the data analysis, 60% of it is utilised in organising and cleaning the data. 19% of the total time is used on gathering the sets of data. In the total time 9% of it is spent in mining the data for drawing different patterns. Among the total time only the 3% is used in the training of the set of data. Only 4% of the total time is utilised in refining the total algorithms. Just 5% of the total time is spent on the other various tasks.
The quality of data is recognised as the functional asset of accurate sets of data. Here the dataset can easily be transformed, measured and combined with other methods of statistics. The dimension of the data quality includes accuracy, integrity, validity, completeness, timeliness and consistency. The accuracy of data quality talks about its reflection on real-world things. Completeness of data quality narrates the requirement of every data.
Week 6
Python is a programming language that is used in computers that are generally used for the generation of software and websites, conducting data analysis and automating tasks. This language can be utilised for generating various programmes and this is not particular for any issues. Python can be used in web development. Scripting, prototyping, machine learning and data analysis, and in the day-to-day task are described. PyCharm is a devoted Integrated Development Environment (IDE) for python (Sadli, 2022). It gives a huge range of necessary tools that are required by the developers of python. This is highly integrated for generating an appropriate environment for the productive development of web, data science and python. Python editor or Jupyter can be used directly for the python programme and Jupyter is the web version.
It is very essential to load the base of the data in python for carrying out any analysis of data. A huge number of packages are accessible in python and this helps the user to carry different activities, specifically in analysing and managing the data. Pandas or numpy package and csv package are used in this action for the activity of the data loading. At first, the provided csv files are dragged and dropped in the project folder of the python and then have to bring in the csv package for usage it utilising the codes to read the file data in the program memory. Then the file will be loaded utilising the reader class of the csv and the output data will be provided in the file. The data must be pulled separately and after removing the col[3] part in the method of printing, the user must observe what will happen.
After that, the package of numpy is loaded and the classes of genfromtxt and loadtxt are imported. The string data that is collected shows the null value or nan by the usage of the genfromtxt class. The reason behind this is that every value is denoted as numeric. Then the dat is loaded utilising the numpy’sloadtxt class and this becomes the largest database among the loaded dataset.
Week 7
Business intelligence refers to a method to take leverage that happens in the processing of raw data during the extraction of crucial information for making any decision for the development of the organisation and business. The intelligence of business process is the combination of analytics, data mining, OAP, BPR, benchmarking, data warehouse and reporting (Rikhardsson and Yigitbasioglu, 2018). Data warehouse is a mixture of intelligence that is gathered from different origins into a single broad base of data. Analytics is done by using analysis and data modelling. Analytics extract important information from crucial data and give the best conclusion that helps to take the best decision for the business from that data. The full form of OAP is Observe, Anticipate and Plan. OAP is the procedure of noting the current trend that is occurring in the business. Through the OAP the solution to a problem can be anticipated and according to that plans are taken into action for increasing the operation of the business.
Mining of data is the utilisation of different numerous techniques and tools. This helps in determining the trends, patterns and occurrences of the events that are based on the data. BPR is the short form of Business Process Reengineering and this is utilised in the restructuring of the workflow of the business. The main goal of the BPR is to give the best services and at the same time decrease the cost. BPR includes 4 steps and that are, identification of process, analysis, update and review, design and redesign, implementation and testing.
Benchmarking is the comparison between the business parameters and the industry at their best practice. The main goal is to help in improving the service quality. The resources are time, visits and technology database and many others (Rusu and Huang, 2019). Reporting tells about the performance and the status of the organisation over time. This data aids to create a conclusion on the performance of the organisation and business. Analytic and business intelligence trends according to 2020 are, Artificial intelligence, and management of data quality, data discovery, augmented analytics, collaborative business intelligence, data automation, mobile BI, embedded analytics data-driven culture, and prescriptive and predictive analytic tools.
Week 8
The next development plan would include the analysis of the data collected and the changes that
occurred due to the adoption of Business Intelligence (BI). This will provide the information about the business organisation and its strategies. The collected data will be analyzed and
studied, along with that, decision would be taken based on the analyses.
Week 9
There will be the recognition of project deliverables and creating project schedule and
milestones. This will help to make proper planning for the project, which would require an
effective schedule. This will help to make project planning, maintain relevant step, accounting
the project and execution of project. The milestone will help to maintain the project planning and
help to prepare estimated budget for any project. Hence it is a vital part that the plan would
include and maintain accordingly.
Week 10
The actual goal of the accounting is to provide many information that is needed for decide decision. All accounts information is generally divided into two parts and all internal and external data are used by the organisation. Internal users are included managers and employees who are managed all financial requirements.
Week 11
External users are maintained by all outside work of any organisations, and increased every information of finance. It is to developed many investors and loan officers and also stakeholders and every organisation is used many types of machine learning and BI so this organisation business is highly developed their business.
References
Alexander, S.M., Jones, K., Bennett, N.J., Budden, A., Cox, M., Crosas, M., Game, E.T., Geary, J., Hardy, R.D., Johnson, J.T. and Karcher, S., 2020. Qualitative data sharing and synthesis for sustainability science. Nature Sustainability, 3(2), pp.81-88.
Andrews, I., Stock, J.H. and Sun, L., 2019. Weak instruments in instrumental variables regression: Theory and practice. Annual Review of Economics, 11(1).
Arieli, S., Sagiv, L. and Roccas, S., 2020. Values at work: The impact of personal values in organisations. Applied Psychology, 69(2), pp.230-275.
Bernard, M., Minarti, E.D. and Hutajulu, M., 2018. Constructing Student’s Mathematical Understanding Skills and Self Confidence: Math Game with Visual Basic Application for Microsoft Excel in Learning Phytagoras at Junior High School. International Journal of Engineering & Technology, 7(3.2), pp.732-736.
Duong, Q.H., Ramampiaro, H., Nørvåg, K., Fournier-Viger, P. and Dam, T.L., 2018. High utility drift detection in quantitative data streams. Knowledge-Based Systems, 157, pp.34-51.
Gaunt, R.E. and Merkle, M., 2021. On bounds for the mode and median of the generalized hyperbolic and related distributions. Journal of Mathematical Analysis and Applications, 493(1), p.124508.
Hamilton, R.H. and Sodeman, W.A., 2020. The questions we ask: Opportunities and challenges for using big data analytics to strategically manage human capital resources. Business Horizons, 63(1), pp.85-95.
Healy, K., 2018. Data visualization: a practical introduction. Princeton University Press.
Jarah, B.A.F. and Almatarneh, Z., 2021. The effect of the elements of accounting information system (AIS) on organizational culture (OC)-A field study. Academy of Strategic Management Journal, 20, pp.1-10.
Mikalef, P. and Krogstie, J., 2020. Examining the interplay between big data analytics and contextual factors in driving process innovation capabilities. European Journal of Information Systems, 29(3), pp.260-287.
Nugroho, M.A., 2019. Analysis of Internal Control of Inventory Accounting Information System at PT. Andre Laurent. Dinasti International Journal of Education Management And Social Science, 1(1), pp.73-86.
Pedersen, E.R.G., Gwozdz, W. and Hvass, K.K., 2018. Exploring the relationship between business model innovation, corporate sustainability, and organisational values within the fashion industry. Journal of business ethics, 149(2), pp.267-284.
Pistorius, F., Baumann, D., Seidel, L. and Sax, E., 2020, December. Intuitive time-series-analysis-toolbox for inexperienced data scientists. In 2020 International Conference on Computational Science and Computational Intelligence (CSCI) (pp. 401-406). IEEE.
Radu, V., Radu, F., Tabirca, A.I., Saplacan, S.I. and Lile, R., 2021. Bibliometric Analysis of Fuzzy Logic Research in International Scientific Databases. International Journal of Computers, Communications & Control, 16(1).
Rikhardsson, P. and Yigitbasioglu, O., 2018. Business intelligence & analytics in management accounting research: Status and future focus. International Journal of Accounting Information Systems, 29, pp.37-58.
Rusu, F. and Huang, Z., 2019. In-depth benchmarking of graph database systems with the Linked Data Benchmark Council (LDBC) Social Network Benchmark (SNB). arXiv preprint arXiv:1907.07405.
Sadli, A., 2022. Using The Python Library to Create Simple Game Animations. International Journal of Management Science and Information Technology, 2(2), pp.21-31.
Waskom, M.L., 2021. Seaborn: statistical data visualization. Journal of Open Source Software, 6(60), p.3021.
Zhou, Z., Liu, J., Pham, D.T., Xu, W., Ramirez, F.J., Ji, C. and Liu, Q., 2019. Disassembly sequence planning: recent developments and future trends. Proceedings of the Institution of Mechanical Engineers, Part B: Journal of Engineering Manufacture, 233(5), pp.1450-1471.