- Empirical Investigation of CAPM and Fama-French Models
- Applying CAPM and Fama-French Models to Evaluate Firm Performance and Market Integration
- a) Presentation and discussion of the CAPM model in empirical practice
- b) Estimation of CAPM by using data and discussion on its results
- c) Hypothesis testing
- d) Discussion on buying or investing in assets of the portfolio
- e) Presentation of the Fama and french model and discussion of its results
- f) Interpretation of the results in the CAPM model and Fama and French model
- g) Discussion on the relationship between the CAPM and Fama and French model
Empirical Investigation of CAPM and Fama-French Models
Applying CAPM and Fama-French Models to Evaluate Firm Performance and Market Integration
a) Presentation and discussion of the CAPM model in empirical practice
The CAPM has been identified as the specific model to value the assets or stocks of a firm in different periods of time. The growth in the financial performance of a firm has been identified by the adoption and implementation of the CAPM model in the financial analysis. The “market return and the risk-free rate of return” have required along with the beta value of a firm for the calculation of beta value (Kayo et al. 2020). The formula “Rf + beta*(Rm - Rf)” has been used to calculate the CAPM of a firm, here Rf has reflected the risk-free return and Rm has denoted the market return. The practical implication of this model has provided effective ideas about the financial performance of specific companies based on their return and share price. As per the opinion of (), the effective implication of this model has provided a specilisation in investment decisions and portfolio management of a firm.
b) Estimation of CAPM by using data and discussion on its results
The data set of 240 different companies listed under “S&P 500 stock price” on a daily basis from January 1990 to September 2021 has been taken for the estimation of the CAPM rate of the firms. The “market return” of the index and “risk-free return” has been provided in the data set for the aforementioned period. It has been identified that CAPM has provided an overview of the actual price of teh stocks of the companies in the market.


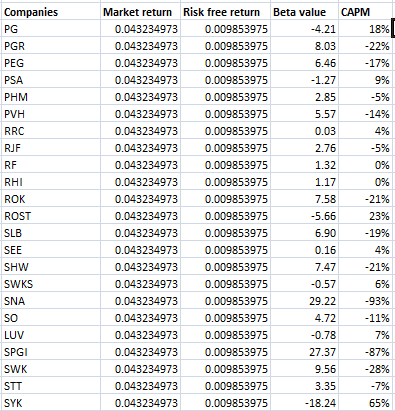
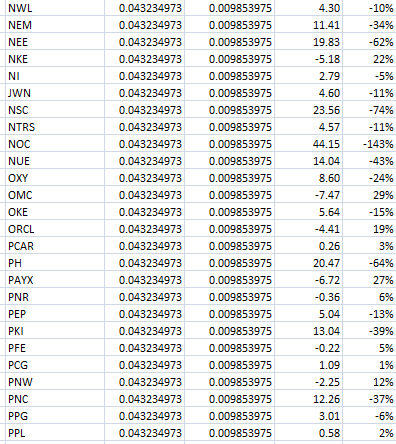
Figure 1: CAPM model of 240 selected stocks
The above figure has reflected the rate of CAPM of the each company listed under the S&P 500 index. The “Beta value” of each company has been calculated by using the slope function in excel by keeping the stock price of the company “X's known value” and “return on Y’s known value”. It has been identified that the COO stock price has the highest value of 103% and LLY stock has a lower price at a CAPM rate is -251% in the last thirty-one years on daily frequency.
c) Hypothesis testing
The “linear regression test” has been conducted for the required hypothesis test related to the assets equilibrium of big and small companies selected companies.
Assumptions
The market return of the index has been taken as the dependent variable and small minus big and higher minus lower value has taken as the independent variable.
Hypotheses
Null hypothesis H0: The market return of the index has not influenced the equilibrium price of stocks of the 240 selected companies in the market.
Alternative hypothesis H1: Market return has influenced the equilibrium price of stocks in the market.
“ r_market | Coef. Std. Err. z P>|z| [95% Conf. Interval]
-------------+----------------------------------------------------------------
hml | -.0708865 .0181311 -3.91 0.000 -.1064227 -.0353503
smb | .0583756 .0211362 2.76 0.006 .0169495 .0998018
_cons | .0436239 .0126482 3.45 0.001 .0188339 .0684139
------------------------------------------------------------------------------
------------------------------------------------------------------------------
Random-effects Parameters | Estimate Std. Err. [95% Conf. Interval]
-----------------------------+------------------------------------------------
var(Residual) | 1.3199 .0205483 1.280234 1.360794”
Table 1: Regression output
The justification for the hypothesis test has presented in table 1 of the analysis. The above table has reflected the output for the regression test for the hypothesis test on equilibrium stock price with the return rate of the index S&P 500. The coefficient value of the output has reflected that there has been a “negative relationship” between the return on “high to market to book (hml)” and the return rate of the index. The coefficient value of hml is -0.07 and “average return of stock (smb)” is 0.058 with the dependent variable. The coefficient value has reflected that there has been a positive storing relationship with the smb and negative relation with the hml with the selected dependent variable. However, here “alternative hypothesis (H1)” has been satisfied and the “null hypothesis (H0)” has been rejected. The “P-value” of the “hml and smb” is 0.00 and 0.006 which has provided evidence for the rejection of the null hypothesis.
d) Discussion on buying or investing in assets of the portfolio
The investment decision has relied on the beta value and market CAPM rate of the companies in the market. The maximum rate of CAPM has been reflected by the company code with “COO” on daily basis in the last thirty-one years in the market. The portfolio of 240 companies' stock prices has been segregated on the basis of “beta value and return of the stocks” on daily basis. The highest beta value has reflected the profitable position and performance of the company in the share market. It has been evaluated that the stock price of the COO has the highest return compared to the return of other 239 companies listed under the index S&P 500. The LLY company’s stock has a negative average return based on the daily data of the last thirty-one years in the market. Investors can ignore investing in the shares or stocks of the company with lower returns and CAPM rates. The company with “higher return rates” and stock prices have reflected zero percentage of risk in investment.
e) Presentation of the Fama and french model and discussion of its results
The “Fama and French three-factor model (1993)” has been used to acknowledge the “return and price” of the securities or stocks of an entity on various periods of time. This model has provided a superior ability to predict in comparison to the CAPM model (Westland, 2020). This method is used to calculate the actual return of companies compared to market return, hml, and price of the stocks in the dynamic market. This model has inverse characteristics of the price-to-book ratio of a firm.

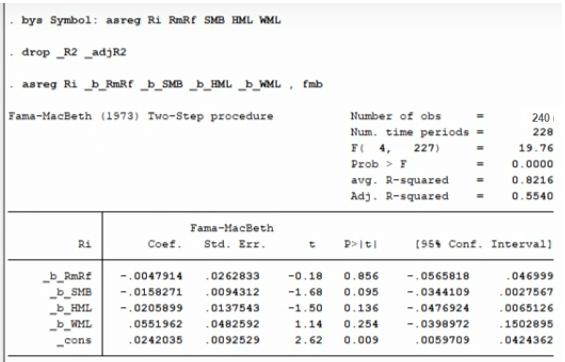
Figure 2: Three-factor Fama-french model output
The effective implication of “the asreg command” has calculated the Fama-Macbeth or “Fama-french test” in the Stata software. However, the above figure has reflected that “risk-free return” has the maximum impact on the return and price of the 240 selected stocks listed under the S&P 500 in the market. The hml variable has minimum impact on the price of the stock in future as its P value is minimal compared to other variables on the price of the companies. The coefficient value reflected that the value of the selected company’s share has positively related to the “market return rate and risk-free return rate” in the market. The coefficient value of the company in respect of three factors is 0.055 this has reflected a positive relationship in an increase in the rate of the price of the shares and stocks of the firm. The data set of 240 companies used on daily basis from 1990 to 2021 in the test has reflected in figure 2.
f) Interpretation of the results in the CAPM model and Fama and French model
The implementation or adoption of two different pricing models has provided two different types of results in the analysis. The CAPM model has reflected the price of the shares or stocks of the company on the “risk-free rate, market rate and beta value” of the companies in the selected periods. The maximum rate of CAPM has reflected the higher value of the stocks and shares of the company in highly competitive marketing. Furthermore, the Fama-french model has calculated the growth in price and values of the company’s shares on the “higher minus lower”, “small minus big” and “market return” of the index in the specific financial year.
The output of the “CAPM model” has reflected that there has been a “positive relationship” between the “beta value, risk-free rate and market return rate” of the company and the index in the market (Nasution et al. 2020). Based on the output of the CAPM model it has been identified that the COO’s stock has a higher rate of growth in the selected financial period. However, the results of the Fama-french model have reflected that company with code WML has a positive growth in their share price in the selected period of time. The P value and coefficient value of the results ahs interpreted in the Fama-french analysis, while the rate of CAPM has been evaluated to acknowledge the best-performing stocks in the market. The coefficient value of WML has higher than other selected coa0pesi as reflected in the above figure.
g) Discussion on the relationship between the CAPM and Fama and French model
The implemented model in section b of the study is the “CAPM model” and in section, e is the “Fama-French model”. It has been acquired that both models have been used for pricing activities and are known as the pricing model in the share market. It has been identified that the Fama-French model has been used to add HML and SMB values to the CAPM valuation (Hou and Chen, 2021). It has identified that beta value calculation has provided an overview of the decision-making facilities to invest in a specific company in a wide portfolio. CAPM has played an effective role in adding a single factor in the equation to measure the standard deviation among the provided return or price of the companies. Both models have depended on the return of stocks to precede further steps in stock pricing. The “Fama-french model and CAPM model” has identified as three-factor models and both failed to explain the actual momentum in the stock returns of the companies.
References
Hou, D. and Chen, Z., 2021, April. Research on the application of Fama-French 5-factor model in the steel industry during COVID-19. In Journal of Physics: Conference Series (Vol. 1865, No. 4, p. 042104). IOP Publishing.
Kayo, E.K., Martelanc, R., Brunaldi, E.O. and da Silva, W.E., 2020. Capital asset pricing model, beta stability, and the pricing puzzle of electricity transmission in Brazil. Energy Policy, 142, p.111485.
Nasution, M.B.A., Siregar, H. and Andati, T., 2020. Indonesian property and real estate return analysis: comparison of Capital asset pricing model and Fama-French three factors model. Jurnal Aplikasi Bisnis dan Manajemen (JABM), 6(1), pp.197-197.
Westland, J.C., 2020. Predicting credit card fraud with Sarbanes‐Oxley assessments and Fama‐French risk factors. Intelligent Systems in Accounting, Finance and Management, 27(2), pp.95-107.
Bibliography
Hollstein, F., Prokopczuk, M. and Wese Simen, C., 2020. The conditional Capital Asset Pricing Model revisited: Evidence from high-frequency betas. Management Science, 66(6), pp.2474-2494.
Jan, S.U., Iqbal, S. and Aamir, A., 2021. Comparing CAPM and FAMA French for Predicting Stock Returns: New Evidence from Pakistan Stock Exchange. Ilkogretim Online, 20(3).
Sehrawat, N., Kumar, A., Nigam, N.K., Singh, K. and Goyal, K., 2020. Test of capital market integration using Fama-French three-factor model: Empirical evidence from India. Investment Management & Financial Innovations, 17(2), p.113.


