Impact of Age, Habits, and Working Conditions on Students' Health Assignment
INTRODUCTION: Impact of Age, Habits, and Working Conditions on Students' Health Assignment
Native Assignment Help provides assignment help to assist students in research, writing and proofreading process.
Here, the students present within the society are the central focus of this research and the various factors that affect their lives are analyzed with the help of the software platform in question. The category called age group of the students essentially acts as the pivot in determining the overall health conditions of the students. The habits also come to the fore when it comes to the aspect of determining the effects of these on the students’ lives in general. The working condition of the people in question plays a very crucial role in this regard.
The aforementioned element combined with the habits can produce significant results as far as the health condition is concerned. This in turn can turn the lives in either positive direction or negative direction, based on the manner in which the two aforementioned factors are put into effect. Certain habits which are harmful for the health of the people could be witnessed in the day-to-day activities of several people. This particular factor not only causes temporary damage to the entire health, but it also paves way for several diseases which could come up in the near future upon continuation of that habit.
Method
Design
The fundamental design of this particular research refers to an “n of 1” experiment. It signifies the fact that this experiment has taken only a single participant into account (Cheung et al. 2022). The dataset in question has information about several factors such as the income of the students in each month and each year, the cost of the students’ home, the age of the students, and many more. The age of the students have been considered as the dependent variable and the independent ones being the income, and home cost amongst others.
Materials
A desktop has been utilized in this context for the purpose of including the data into the system as well as analyzing it for that matter (Cooper et al. 2020). The data set that has been taken up to perform this specific research is collected from an online platform in particular.
Procedure
Here, the software platform called “Jamovi” has been taken into consideration so as to do this research properly. As data is the very foundation of this research, a pertinent set of data is fetched from the previously mentioned platform for incorporating it into the software (Kronish etal. 2019). As the data has been successfully included into the software, various tools of data analysis are used to acquire the respective results.
Results
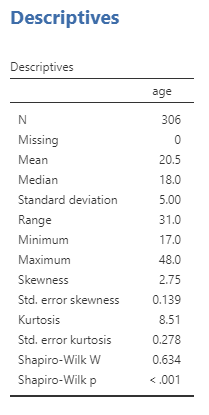
Figure 1: Data Descriptive
The above image displays I am allow all of the factors whose values have been obtained in the process of data analysis. The variable which has been considered in performing the aforementioned task is “age” in this case (Kwasnicka et al. 2020). The values of some of the showcased factors such as “Range”, “Kurtosis”, “Skewness”, and “Standard Deviation” are “31.0”, “8.51”, “2.75”, and “5.00” respectively.
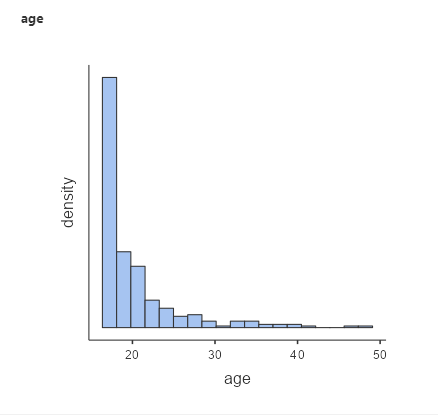
Figure 2: Age vs. Density Plot
The “age vs. density” plot has been showcased by way of the above picture. All of the information present in the column named “age” is considered while plotting the above figure.
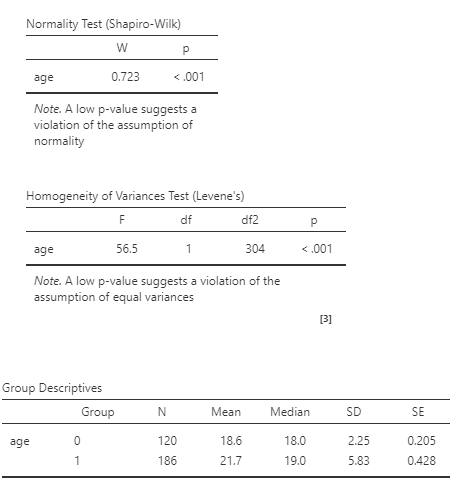
Figure 3: Normality Test
This picture represents the two vital tests that have been performed on the data housed within the column known as “age (Kwasnicka et al. 2019). These are “Normality Test”, and “Levene’s Test” respectively. A former is utilized so as to determine the fact that whether or not a sample data is drawn from the “normally” distributed population. The obtained value has stated within a certain tolerance limit for that matter.
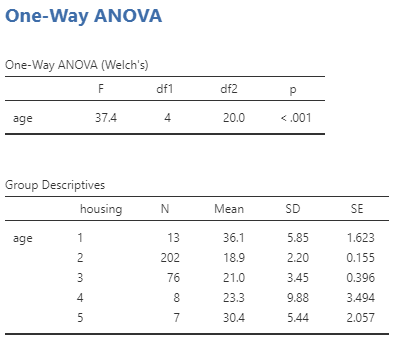
Figure 4: One-Way ANOVA Test
The image attached above showcased the results obtained after properly performing the “One-Way Anova” test on the column known by the name “age” (McDonald et al. 2020). This test helps me to investigate whether the variations or various levels of such a factor contain a “measurable” effect on the dependent variable.
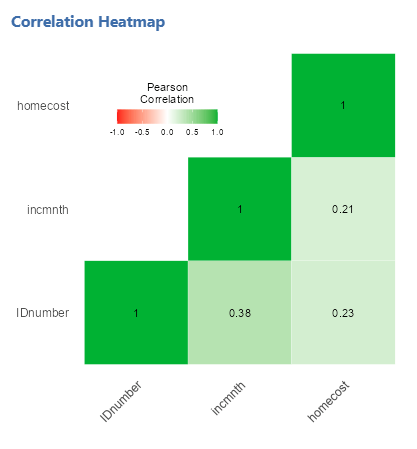
Figure 5: Correlation Heat map
This picture displays a correlationheat map taking the data inside the columns such as “homecost”, “incmnth”, and “IDnumber” respectively into account (Senarathne et al. 2020). It is a kind of plot which assists in visualizing the underlying strength of the relationships amongst all of the numerical variables.
for uncovering the underlying framework of the relatively huge set of “variables” in this case.
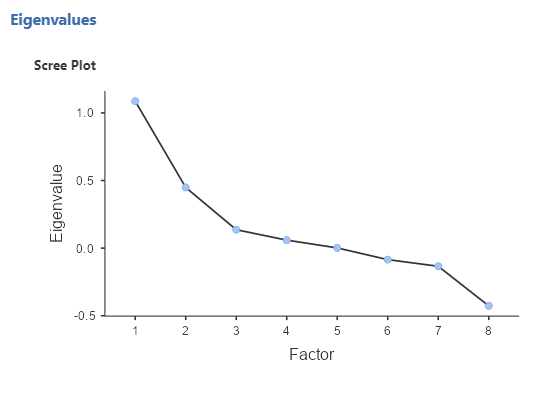
Figure 6: Scree Plot
The “Scree” plot is displayed by way of this image. It showcases the “eigenvalues” on the “y-axis”, and the quantity of “factors” on the “x-axis” respectively.
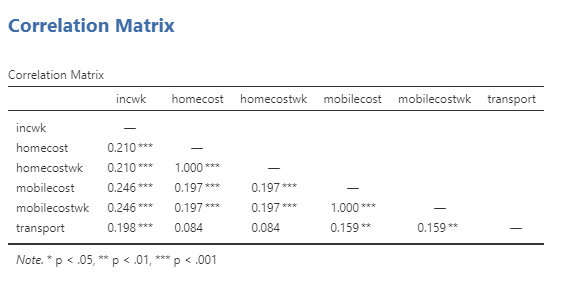
Figure 7: Correlation Matrix
This picture displays the “correlational matrix” based upon the data in question. This table showcases the “correlation coefficients” for the different variables taken into account in this context.

Figure 8: Linear Regression
In this image, the aspect of performing linear regression has been shown (Tudor et al. 2020). This specific analysis helps in predicting the value regarding a particular variable predicated upon the value of any other variable.
Discussion
The required software platform has been taken into account suitably for the sole objective of performing the required objectives. The dataset can helps me to fed into the concerned software platform so as to perform the process of data analysis on it. Several of the required statistical tests are performed that have generated the required outcomes, provided in the previous section. The dependent and independent variables have been considered in the first place which have been taken as input elements for several statistical tests done earlier in this research.
References
Cheung, K. and Mitsumoto, H., 2022. Evaluating personalized (N-of-1) trials in rare diseases: How much experimentation is enough. Harvard Data Science Review.
Cooper, K.B., Wilson, M.R. and Jones, M.I., 2020. The impact of sleep on mental toughness: Evidence from observational and N-of-1 manipulation studies in athletes. Sport, Exercise, and Performance Psychology, 9(3), p.308.
Kronish, I.M., Cheung, Y.K., Julian, J., Parsons, F., Lee, J., Yoon, S., Valdimarsdottir, H., Green, P., Suls, J., Hershman, D.L. and Davidson, K.W., 2019, December. Clinical usefulness of bright white light therapy for depressive symptoms in cancer survivors: Results from a series of personalized (n-of-1) trials. In Healthcare (Vol. 8, No. 1, p. 10). MDPI.
Kwasnicka, D. and Naughton, F., 2020. N-of-1 methods: A practical guide to exploring trajectories of behaviour change and designing precision behaviour change interventions. Psychology of Sport and Exercise, 47, p.101570.
Kwasnicka, D., Inauen, J., Nieuwenboom, W., Nurmi, J., Schneider, A., Short, C.E., Dekkers, T., Williams, A.J., Bierbauer, W., Haukkala, A. and Picariello, F., 2019. Challenges and solutions for N-of-1 design studies in health psychology. Health psychology review, 13(2), pp.163-178.
McDonald, S., Vieira, R. and Johnston, D.W., 2020. Analysing N-of-1 observational data in health psychology and behavioural medicine: a 10-step SPSS tutorial for beginners. Health psychology and behavioral medicine, 8(1), pp.32-54.
Senarathne, S.G.J., Overstall, A.M. and McGree, J.M., 2020. Bayesian adaptive N‐of‐1 trials for estimating population and individual treatment effects. Statistics in Medicine, 39(29), pp.4499-4518.
Tudor, K., Brooks, J., Howick, J., Fox, R. and Aveyard, P., 2022. Unblinded and blinded n-of-1 trials versus usual care: a randomized controlled trial to increase statin uptake in primary care. Circulation: Cardiovascular Quality and Outcomes, 15(6), p.e007793.