Fat and Protein Analysis
Introduction: Food Composition And Analysis
In this experiment the determination of fat and protein analysis in cheese is done. The objective of the research is to develop and evaluated the rapid performance method for measuring of protein and fat concentration. This is mainly utilized by the combination mid infrared transmittance analysis with milk analysis conductivity sensors. It blends with the dissolving liquid solution containing the disodium met silicate.
In this part, the performance is modified about the fat and protein analysis of the cheese. By maintaining the main structure of the performance analysis, it can be given a proper structure to understand the contribution of cheese to fat-containing agent. The analytical performance of cheese must be blended and diluted with the dissolver at a temperature of 65+/-2°C. this research will evaluated the fat and protein concentration in Cheese with the describing the methods , actual result with discussion.
Method
In the measurement of 100gm of standard cheese, it is given for identifying there standardization factors of fat and protein analysis. Mainly the standard level of sodium is prepared from 0-10ml-1by maintaining the series of dilutions. Fat and protein analysis of cheese is modified through the mentioned manual information of cheese. The reading of the photometer is very necessary for this structure to adjust the control of sensitivity. The necessary steps are recognized through 0, 5, 10, 15 & 20 because the marking is useful to understand the situation through the reflection of the photometer. In this performance, the stock solution is contained in the amount of 500ml and it is useful to understand the nutritional aspect of cheese (Delgado et al. 2021). If the chemical turns blue, it can be said that the cheese is full of nutritional value and if the chemical turns pink, it can be mentioned that the nutrition value is less in the cheese.
The common factors are protein, and fat levels to understand the analyzing effects of cheese. Here the other procedure is the application variant of cheese where it is important to improve the quality of them. The fat testing method of cheese is accomplished through the method of Gas Chromatograph (GC). Along with this, as the amount of 70% is casein protein and 30% is whey protein, the quality of the case in protein is very necessary to increase its nutritional value. 34 comprehensive Cream cheese specimens, each representing a separate batch of cheeses from a single big industrial cheese plant, were used to calibrate the MIR dairy detector. in the experiment respectively, provide the verification test data for such NIR and MIR assessment of both the 36 cheddar for dryness and lipid. Every plant's quality control facility assessed its own cheddars and used an NIR that was validated utilizing food made at the facility and used the redox titration technique and its own benchmark chemicals.
The cheddar graph's standard biochemistry for fat, cholesterol, salty, and total saline was established, and a quadratic gradient and interception correction was produced for fat estimate (individually for fat A, B, & Performance indicators). Among neutrality and polarity fats, fatty A is an fat seriously consider on the aldehyde stretching, whereas fat B is predicated on the number of hydrocarbons corridor. Cheese dissolver solution is added for the places of 4 decimal. The entire process of the Chesses analysis is performed by 3 stages. Chesses finding and storage, dissolver solution, and preparing of cheese.
Result
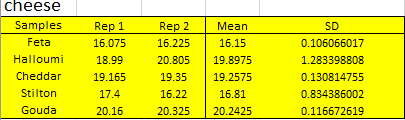
Table 1: Mean and standard deviation
Feta, halloumi, cheddar, stilton, and Gouda were sampled. The mean values of the cheese are 16.15, 19.8975, 19.2575, 16.81, and 20.2425 based on the graph and the preceding table (Giarettaet al. 2019). These values for the standard deviation are 0.106066, 1.283398, 0.130814755, 0.83438600, and 0.116672619. According to the values, Gouda cheese is more valuable than other types of cheese. The feta cheese is made with the average and standard deviation that are the lowest. This result will help you to get a clear picture of the samples of fat and protein including Feta, halloumi, cheddar, stilton and Gouda samples these are cheese samples the mean values are given above in the chart.
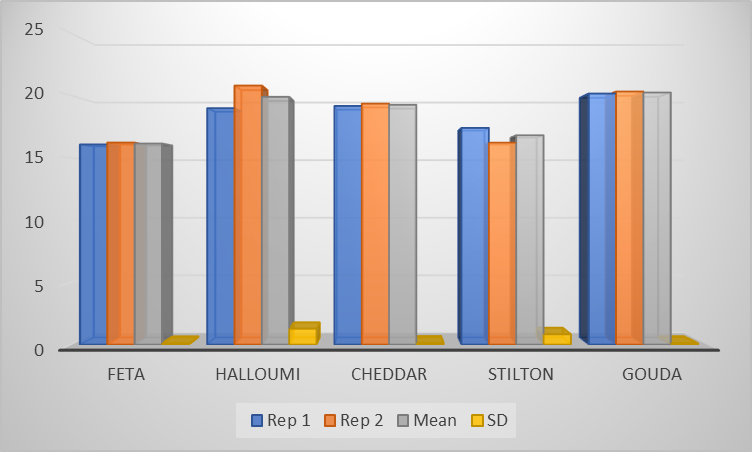
Figure: 1: Graphical representation
The samples taken are feta, halloumi, cheddar, stilton, and Gouda. On basis of the graph and the above table, the mean values of the cheese are the values are 16.15, 19.8975, 19.2575, 16.81, and 20.2425 (Cortés et al. 2021). And the standard deviation is 0.106066, 1.283398, 0.130814755, 0.83438600, and 0.116672619. The values are indicating that Gouda cheese has a higher value rather than the other cheese. The lowest mean and the standard deviation are crafted in the feta cheese. All the data are estimated as per the value retained in this food analysis. The
Graphical structure clarifies that according to the given data halloumi shows the higher peak values that lie on 20 to 25 % of protein contents.
With the use of different methods, the calculations are created here for the protein and fat data. These data help to get a basic idea of fat and protein having different cheese products. Results are the main source from where the actual outcome can be made.
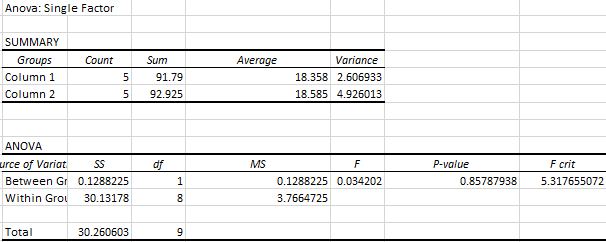
Figure 2: Anova
By the Annova testing method, the findings are summarized in the calculation of the fat and protein analysis. As per the table and the analysis, the sum of the column is 91.79. The sum of column 2 is 92.925 (De et al. 2020). And the beverages are 18.358 and 18.585. In describing the invariants it is disclosed that the df values of both variants are 0.1200225 and 30.13178. The p-value is 0.85787938. The test is performed by a single factor with the mentioned protocol. Therefore, it clearly shows the outcome that has come in the results as the results show the proper picture
Discussion
Here the main specification is on fat and protein analysis of cheese to explore the performance in a better way. Several things like protein and fat analysis are key things that can be seen in products like protein-related food structure. The obvious reason is the differences over WA are related to solute, sodium, protein, and fat, high protein concentrations can make slow gastric emptying (10). Protein beverages emptied slower than 60g protein and 70g fat in ground cheese. However, it has been seen that the concentration of protein in sports ground cheese is very critical in hydrating the potential of beverages. Having a larger amount of fat is also not that good but despising cheese is needed which contains added minerals as well as fat and protein. Ground cheese can give health to human beings. They need a proper diet and proper workout to maintain a good and healthy life so some protein and fat are required. A slim body needs some fat and protein to gain weight. Maintaining a healthy life can make a level to this both. Fat and protein need to be very determined. These two things are important in the body the growth depends on fat and protein somehow. Sometimes metabolism doesn't cooperate with fat and protein so the body doesn't get change, its structure of the body. Cheese is an important ground cheese for everybody. The cheese contains water, carbohydrates, fat, protein, electrolytes, and with some other nutrition. Examples of cheese are feta, halloumi, cheddar, stilton, and Gouda. This ground cheese is an early-stage development ground cheese still in its infancy. Ground cheese generally burns calories this protein ground cheese gives charm and strength too. Students generally prefer this for fitness and while doing exercise, and ground cheese should be selected before exercise or while workout. Now there ismuchstructural ground cheese that helps at different times, the glycogen rate goes a bit fast if they are within 2 hours post-exercise. This gains energy while people sweat a lot, if they are physically tired they can have processed cheese immediately. Sometimes fat can be the main energy substance by making the required exercise for energy, and the volume and number of fat cells in the body reduces. Physical health should be maintained by everyone to get relief from physical and psychological pressure so some good exercise and a good cheese with fresh oxygen are very much important. Now fat and protein are needed in some amount for every human body. Ground cheese is mainly restored for the consumption of muscle glycogen, blood sugar is also decreased (Anunciação, 2019). There are many studies about impact of cheese on human body in different countries. Research positively affects and impact positive effect and impacts the health of athletes and normal human beings. This leads to a functional state of mind and maintains the body's fluid balance during the exercise. Many advertisements for processed cheese are shown to attract people and people can make a decision about which one is better. Cheese is very popular throughout the country as generally contains protein, and fats and protein are very essential for every human body. The body needs some growth strength stamina etc. which the ground cheese helps to improve. Consumption of ground cheese is very much positive for the human body and it helps to have some different tastes and preferences for the people, to try some new things which can really help people for better physic. There are many things of protein and fat but for good health, it is important to have better products including fat-containing products. These products are generally found in every store and shop now people are so eager to buy the product that they are placing an online order. This ground cheese has a good impact on society for better health. For better health cheese is the best choice so anyone can go for it, the price is reasonable this ground cheese can be seen on the ground while match that players are consuming it. It is carried everywhere by the sports federation for the players. Ground cheese gives high protein to everyone and gives stamina to all age people to make easy digestion and makes the digestive system good and stable, the ground cheese also helps to build the body in a proper structure it's a kind of supplement also which is not harmful. It gives long-term energy while lifting the weight and relief from hypertension. This protein helps to gain fat and makes the body temperature normal and cool. There will be changes in the body and improving health is one of the best things that should be better. Human beings in the present day saved a lot of time to improve productivity. Nutrition helps to improve the productivity of the human body. The cheese is far better than many other foods which have more fats like any other recommended fatty foods.
Sodium and Potassium Analysis
Introduction
Any sporting beverage is utilized in conjunction with athletic activity and can be ingested before, throughout, or after regular workouts. Several micronutrients and other materials will be absorbed in water to create the final positive relationship between prices. Sports drinks are intended to expedite rehydrate, encourage quick fluid intake, offer carbohydrates as a fuel source for usage while exercising, lessen the physical changes of exertion, and support rehabilitation after physical activity. Waters, carbs, sodium (Na), and k are the conventional constituents of diet drinks lacking tastes and coloration. The traditional simple method is used for the Sodium and potassium identification in the samples that are biological with this emission of photometry of flame. It is extensively used for the earth's metals and the principle that revealed the characteristic. The elements of Na and potassium have various wavelengths. The main purpose of this experiment is determining the understanding of the value of sodium.
Method
The stock standard solution given to sodium and potassium is 1000ppm, from this only the preparation started for working standard solution. The preparation of sodium and potassium is made by the range of 0-20mgl, through dilutions series. Corning 410 was set in the instruction of the manual (223BMS mini projects sheet). The sodium filter is selected and the standard 20ppm which is given in 2ml in 100ml is chosen to adjust the control on sensitivity, and it can get a reading of 100 (Jafarpour et al. 2020). The introduction of blank is done to the photometer for zero control to get zero reading. This step is done twice to get better accuracy and better readings. The same thing is done for potassium as well with the same procedure using 20ppm standard solution which is prepared from 1000ppm stock solution demonized water is used as diluents. In 50ml standard was made, 0 (blank), 5, 10, 15, and 20 (ppm) standards marked the deionizer water which is measured by flame photometer three times. The calibration curve was produced according to this method. The sample solutions are made from monster rehab drinks, to determine K and Na concentrations. Potassium was diluted by 1/20 dilution factor (5ml in 100ml). In a 25ml volumetric flask, the K and Na were filtered, before introducing them to the instrument to avoid large uneven particulates, which can block the nebulizer (Ma et al. 2021). Hence, the sodium sample is diluted by a 1/50 dilution factor (2ml in 100ml). Both samples are measured three times to get better accuracy in the results. The emission of the sample is recorded and a calibration curve is produced to determine the concentration of each sample.
Result
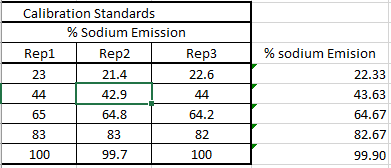
Table 2: Sodium data
In the calibration standards, the emission of sodium is analyzed here. The standard deviation of the sodium level in the burnout syndrome (Hannah et al. 2018). The table shows that the replication value of one is greater than the replication 2 value of the cheeses.

Figure 2: Graphical representation to make the comparison
The graphical representation shows that in the graph, it is shown that the replication value of one is greater than the replication 2 value of the cheeses (Musarurwa et al. 2019). The replication of the different samples is exhibited here.
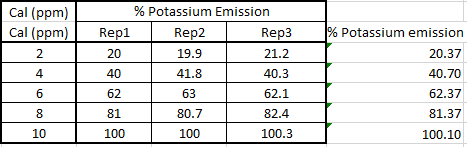
Table 3: Potassium content
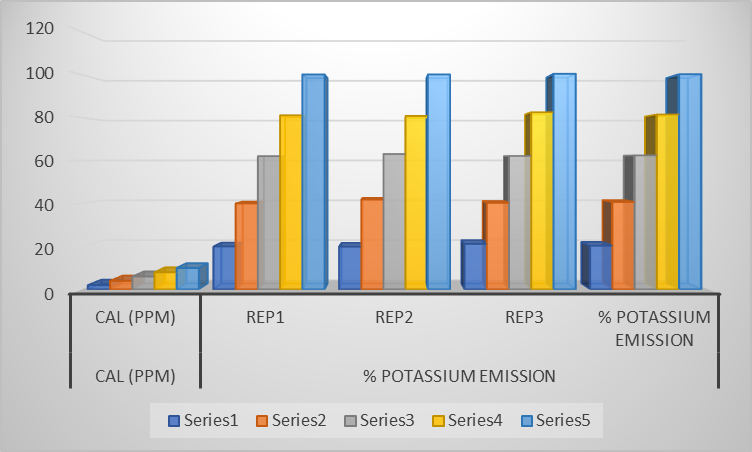
Figure 3: potassium data
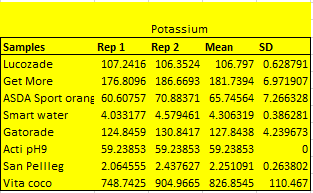
Table 4: Mean and standard deviation of potassium
The mean and potassium standard deviation are shown in the table. The visual depiction demonstrates that the maxim indicates that each variable is worth 106. 3524. And the upper limit of the mean value for the lower level of the variables is 2.5210 (Tomar et al. 2021). These tests are carried out theoretically enclosing the standard curves of food composition in the bigger sample. The samples are determinate as per the data of the different reps. like 1, 2, and 3.
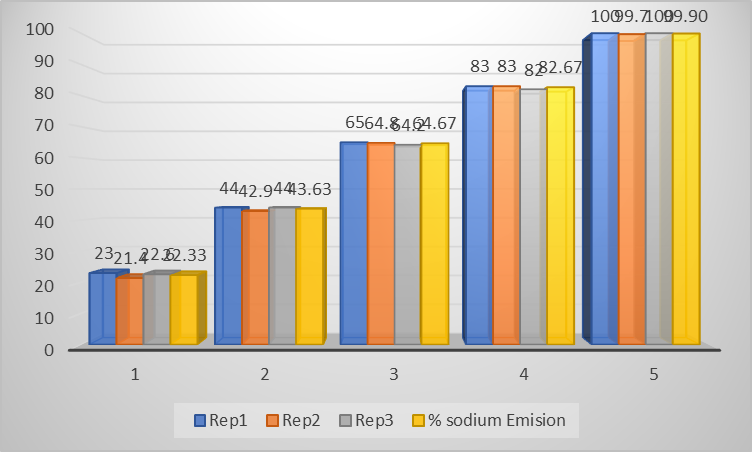
Figure 4: Graphical representation to make the comparison of potassium
The graphical representation and table show the men and the standard deviation value of the potassium. The graphical representation shows that the maxim means the value of the variables is 106. 3524 (Ma et al. 2021). And the maximum mean value is in the 2.5210 value of the lower level of the variables. In the larger sample, these tests are performed hypothetically enclose the standard curves of food composition. The comparison of the variables is relevantly emphasized in the above presentation and it enclosed the determination of the different statistical studies.
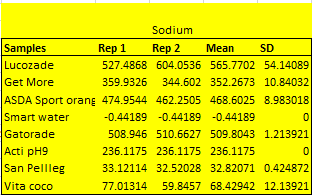
Table 5: Mean and standard deviation of Sodium
The above table illustrates the males and the sodium standard deviation value. The graphical depiction demonstrates that the maximum mean value for the variables is 565.55 and that the smart water sample has the highest mean value (Ndanuko et al. 2020). Theoretically, these tests are conducted by enclosing the typical food composition graph in the larger sample.
The graphical representation and table show the men and the standard deviation value of Sodium. The graphical representation shows that the maxim means the value of the variables is 565.55 and the maximum mean value is in the smart water sample (Pérez et al. 2021). These tests are carried out theoretically enclosing the standard graph of food composition in the bigger sample. The presentation above appropriately emphasizes the comparisons of the variables and includes the conclusions of much statistical research.
Discussion
Several performances by sodium and potassium of key biological functions in the body of human beings. The blood volume of Na and the Impact on the normal muscle and function of the nerve have been maintained. Though a key role is played by K in smooth muscle and skeletal contractions, and it is very essential for muscles and digestive function. This thing can create a lot of potassium and sodium. Maintaining a healthy life can make a level to this both. Sodium and potassium need to be determined. The curve of calibration used in general is the substances in the range of the curve of calibration to create unknown concentrations from light emittance. Emission intensity is directly proportional to concentration to predict the results. Calibration curve intensity is prepared (Cortés et al. 2021). Calibration curve showing the concentration of sodium and potassium. Na concentration is around 10mgl and K is around 12mgl. Low concentration in riper energy drink of K, normal level in the blood of K is 3.5 to 5 moll/l=mg/dl 18, and the same with Na. These minerals have low levels in monster energy drinks. For the determination of trace in metals in solution is done by flame spectrometry, the experiment can have a lot of errors as it is very poor pipetting calculating skills. In the calibration standards, the emission of sodium is analyzed here. The standard deviation of the sodium level in the burnout syndrome. The calibration curve determines the levels of concentration of Na and K in a monster energy drink. But one thing which came out, as a result, is that it is not harmful to the human body as it has 12 and 10(ppm). However, all the samples were measured very accurately because it measured three times and filtered well. In monster drinks, sodium and potassium are not the only minerals.
Regarding the outcomes, everything is accurate and consistent, and the study was successful. To ensure the correct observations, the known amount was first tested 2 - 3 times. The mean of each triple was then computed, logged, and used to create the titration curve. To ensure the accuracy of the results, the liquid samples were tested 2 - 3 times. Additionally, the mixture was filtered to get rid of any particles that could have clogged the equipment. To prevent lost or forgotten samples or standards, each measuring cylinder was labeled. Furthermore, there might have been flaws in the test due to inadequate filtration or math abilities. Residual concentrations of metals in liquids are frequently determined using flame spectroscopy. The amount of the tracer in the liquid being evacuated is approximately inversely related to the brightness of emissions. So, a fluorescence intensities calibrated curve that functions as a dependence on the accumulation is created. The percentage of Na or K in the solution is shown by the red spots on both calculated values. In the larger sample, these tests are performed hypothetically enclose the standard curves of food composition. The comparison of the variables is relevantly emphasized in the above presentation and it enclosed the determination of the different statistical studies. Theoretically, these tests are conducted by enclosing the typical food composition graph in the larger sample. The comparisons of the variables are adequately emphasized in the presentation above, which also incorporates the results of extensive statistical analysis.
As can be observed, the Na and K concentrations were both approximately 10 mg-1. Due to the low content of K in the Demon Sourer cola, the typical range of K values in circulation is between 63 and 90 mg/l.The much more frequent uses are in specific practice or the measurement of Na, K, Ca, and Mg in biomolecules. Na in flaming emissions has a detection range of 0.001 ppm, while K has a threshold of 0.001 ppm. The equipment has good sensitivity since the differential between zero and a little pulse is monitored; however, the susceptibility is only as sensitive also as the detector's responsiveness and stabilization as well as the safety of the combustion suction mechanism additionally, due to the great responsiveness of this approach, the R2 numbers. The concentration level of Na and K in the energy drink is determined by the calibration curve. The result is shown that potassium and sodium have a lower concentration and are not so harmful to the human body. The experiment that is done is accurate as body retention is needed. It measures around approx. 3 times with the filtration process. Living a healthy lifestyle can contribute to both of these things. A determination of sodium and potassium is necessary. The chemicals in the calibration curve's range are generally used to generate unidentified concentrations from light emittance. To forecast the outcomes, emission intensity is inversely related to concentration. The intensity of the calibration curve is prepared. Calibration curve displaying the sodium and potassium concentrations. Na and K concentrations are both approximately 10 mg. Low concentration of K in riper energy drinks; typical levels of K and Na in the blood are 3.5 to 5 moll/l=mg/dl 18 and 18.
Native Assignment Help provides assignment help to assist students in research, writing and proofreading process.
Reference List
Journals
Anunciação, P.C., Giuffrida, D., Murador, D.C., de Paula Filho, G.X., Dugo, G. and Pinheiro-Sant’Ana, H.M., 2019. Identification and quantification of the native carotenoid composition in fruits from the Brazilian Amazon by HPLC–DAD–APCI/MS. Journal of Food Composition and Analysis, 83, p.103296.
Carlsen, M.H., Andersen, L.F., Dahl, L., Norberg, N. and Hjartåker, A., 2018. New iodine food composition database and updated calculations of iodine intake among Norwegians. Nutrients, 10(7), p.930.
Chao, L.I.U., Wenbo, L.I., Bowen, L.I., Peipei, Y.A.N.G., Dongpo, X.I.A. and Jinhua, L.I., 2021. Food composition and nutrients of wild Tibetan macaques (Macaca thibetana) in winter. ACTA THERIOLOGICA SINICA, 41(6), p.649.
Cortés, W.R.B., Mejía, S.M.V. and Mahecha, H.S., 2021. Consumption study and margin of exposure of acrylamide in food consumed by the Bogotá population in Colombia. Journal of Food Composition and Analysis, 100, p.103934.
De Silva, A.K.H. and Rupasinghe, H.V., 2020. Polyphenols composition and anti-diabetic properties in vitro of haskap (Lonicera caerulea L.) berries in relation to cultivar and harvesting date. Journal of Food Composition and Analysis, 88, p.103402.
Delgado, A., Issaoui, M., Vieira, M.C., Saraiva de Carvalho, I. and Fardet, A., 2021. Food composition databases: Does it matter to human health?. Nutrients, 13(8), p.2816.
Fauziyah, A.N. and Mahmudy, W.F., 2018. Hybrid Genetic Algorithm for Optimization of Food Composition on Hypertensive Patient. International Journal of Electrical & Computer Engineering (2088-8708), 8(6).
Giaretta, E., Mordenti, A., Palmonari, A., Brogna, N., Canestrari, G., Belloni, P., Cavallini, D., Mammi, L., Cabbri, R. and Formigoni, A., 2019. NIRs calibration models for chemical composition and fatty acid families of raw and freeze-dried beef: A comparison. Journal of Food Composition and Analysis, 83, p.103257.
Hannah, J., Roe, M., Warthon-Medina, M., Pinchen, H., Barrett, M. and Perry, S., 2018. Phosphorus in food: limitations of food composition data. Journal of Kidney Care, 3(6), pp.362-367.
Jafarpour, A., Gomes, R.M., Gregersen, S., Sloth, J.J., Jacobsen, C. and Sørensen, A.D.M., 2020. Characterization of cod (Gadus morhua) frame composition and its valorization by enzymatic hydrolysis. Journal of Food Composition and Analysis, 89, p.103469.
Ma, P., Li, A., Yu, N., Li, Y., Bahadur, R., Wang, Q. and Ahuja, J.K., 2021. Application of machine learning for estimating label nutrients using USDA Global Branded Food Products Database,(BFPD). Journal of Food Composition and Analysis, 100, p.103857.
Memon, A.A., Mahar, I., Memon, R., Soomro, S., Harnly, J., Memon, N., Bhangar, M.I. and Luthria, D.L., 2020. Impact of flour particle size on nutrient and phenolic acid composition of commercial wheat varieties. Journal of Food Composition and Analysis, 86, p.103358.
Millar, K.A., Gallagher, E., Burke, R., McCarthy, S. and Barry-Ryan, C., 2019. Proximate composition and anti-nutritional factors of fava-bean (Vicia faba), green-pea and yellow-pea (Pisum sativum) flour. Journal of Food Composition and Analysis, 82, p.103233.
Musarurwa, H., Chimuka, L., Pakade, V.E. and Tavengwa, N.T., 2019. Recent developments and applications of QuEChERS based techniques on food samples during pesticide analysis. Journal of Food Composition and Analysis, 84, p.103314.
Ndanuko, R.N., Dunford, E.K., Wu, J.H., Raubenheimer, D. and Neal, B.C., 2020. Changes in sodium levels of processed foods among the International Food and Beverage Association member companies in Australia: 2013–2017. Journal of Food Composition and Analysis, 87, p.103405.
Özdemir, Z.B., Erdem, Y. and Bat, L., 2018. Food composition and distribution of gelatinous macrozooplankton in the southern Black Sea.
Panebianco, F., Nava, V., Giarratana, F., Gervasi, T. and Cicero, N., 2021. Assessment of heavy-and semi-metals contamination in edible seaweed and dried fish sold in ethnic food stores on the Italian market. Journal of Food Composition and Analysis, 104, p.104150.
Pérez-Burillo, S., Molino, S., Navajas-Porras, B., Valverde-Moya, Á.J., Hinojosa-Nogueira, D., López-Maldonado, A., Pastoriza, S. and Rufián-Henares, J.Á., 2021. An in vitro batch fermentation protocol for studying the contribution of food to gut microbiota composition and functionality. Nature Protocols, 16(7), pp.3186-3209.
Pérez-Burillo, S., Pastoriza, S., Jiménez-Hernández, N., D’Auria, G., Francino, M.P. and Rufián-Henares, J.A., 2018. Effect of food thermal processing on the composition of the gut microbiota. Journal of agricultural and food chemistry, 66(43), pp.11500-11509.
Shokunbi, O.S., Adepoju, O.T., Mojapelo, P.E., Ramaite, I.D. and Akinyele, I.O., 2019. Copper, manganese, iron and zinc contents of Nigerian foods and estimates of adult dietary intakes. Journal of Food Composition and Analysis, 82, p.103245.
Tang, C.C., Ameen, A., Fang, B.P., Liao, M.H., Chen, J.Y., Huang, L.F., Zou, H.D. and Wang, Z.Y., 2021. Nutritional composition and health benefits of leaf-vegetable sweet potato in South China. Journal of Food Composition and Analysis, 96, p.103714.
Tomar, M., Bhardwaj, R., Kumar, M., Singh, S.P., Krishnan, V., Kansal, R., Verma, R., Yadav, V.K., Ahlawat, S.P., Rana, J.C. and Bollinedi, H., 2021. Nutritional composition patterns and application of multivariate analysis to evaluate indigenous Pearl millet ((Pennisetum glaucum (L.) R. Br.) germplasm. Journal of Food Composition and Analysis, 103, p.104086.
Go Through the Best and FREE Case Studies Written by Our Academic Experts!
Native Assignment Help. (2026). Retrieved from:
https://www.nativeassignmenthelp.co.uk/food-composition-and-analysis-case-study-20433
Native Assignment Help, (2026),
https://www.nativeassignmenthelp.co.uk/food-composition-and-analysis-case-study-20433
Native Assignment Help (2026) [Online]. Retrieved from:
https://www.nativeassignmenthelp.co.uk/food-composition-and-analysis-case-study-20433
Native Assignment Help. (Native Assignment Help, 2026)
https://www.nativeassignmenthelp.co.uk/food-composition-and-analysis-case-study-20433
- FreeDownload - 1357 TimesCW Samsung- Managing Innovation In Business
Introduction: CW Samsung- Managing Innovation In Business The purpose of...View or download
- FreeDownload - 2189 TimesUnit 417 Factors Influencing Inclusive Learning Practices: Individual, Cultural, Policy Frameworks Case Study
Factors Influencing Inclusive Learning Practices: Individual, Cultural, Policy...View or download
- FreeDownload - 1183 TimesStrategic Analysis of Hotel Savoy and Premier Inn: Hospitality Business Management Insights Case Study
Strategic Analysis of Hotel Savoy and Premier Inn: Hospitality Business...View or download
- FreeDownload - 797 TimesAbnormal Psychology Case Study
Abnormal Psychology Are you in search of the best assignment help in the UK?...View or download
- FreeDownload - 414 TimesApplying Millers Four Pillars Model: Addressing Michael Needs in Care Case Study
Introduction: Applying Millers Four Pillars Model: Addressing Michael Needs in...View or download
- FreeDownload - 750 TimesBMM3003 - Introduction To Business Operations And Management Reflection Report Case Study
Introduction: BMM3003 - Introduction to business operations and management...View or download
-
100% Confidential
Your personal details and order information are kept completely private with our strict confidentiality policy.
-
On-Time Delivery
Receive your assignment exactly within the promised deadline—no delays, ever.
-
Native British Writers
Get your work crafted by highly-skilled native UK writers with strong academic expertise.
-
A+ Quality Assignments
We deliver top-notch, well-researched, and perfectly structured assignments to help you secure the highest grades.

