1. Introduction
Biomass gasification is a process of converting biomass into synthesis gas or syngas inclusive of CO, H₂ and CH₄ for power production. This process is useful in the promotion of renewable energy sources hence reducing the reliance on the conventional source of power that relies on fossil energy since this causes the emission of carbon. In the case of the 1 MW biomass gasification plant, a Circulating Fluidized Bed (CFB) Gasifier has been opted for selection as it has high efficiency ranging from 85% to 90%, capable of handling a wide variety of fuels, and it has a less emission rate as compared to other gasifiers. The CFB gasifier provides the best option for getting high-quality syngas with low tars, and high thermal stability and can support power generation continuously.
2. Plant Optimization
Among the various factors that need to be carefully identified when designing a biomass gasification plant, the choice of the gasifier is a very important one. In the case of biomass gasification of 1 MW, a Circulating Fluidized Bed (CFB) Gasifier is a better alternative because of its high efficiency, compatibility with different types of biomass fuels and high performance (Liu et al. 2022). The CFB gasifiers are those in which there is a continuous circulation of solid particles in the reactor to facilitate heat transfer, good mixing and high efficiency in the process of gasification.
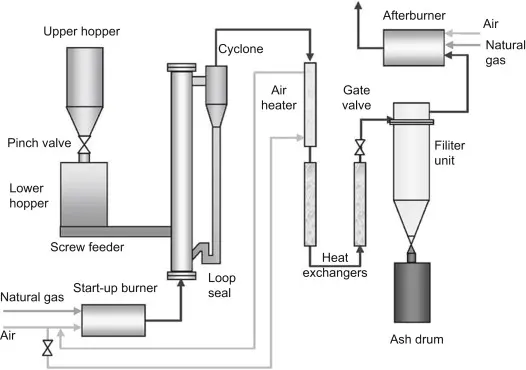
Figure 1: Circulating Fluidized Bed Gasifier
From the above categories of gasifiers including the Updraft Gasifier, Downdraft Gasifier, Bubbling Fluidized Bed Gasifier, Entrained Flow Gasifier, and Circulating Fluidized Bed Gasifier the CFB Gasifier is better because it possesses:
It is better in fuel flexibility compared to the fixed-bed gasifiers.
Higher thermal efficiency due to enhanced mass and heat transfer.
Lower tar production to the effect that the quality of the produced syngas is enhanced.
| Category | Specification |
|---|---|
| Gasifier Type | Circulating Fluidized Bed (CFB) |
| Fuel Type | RDF Biomass (Refuse-Derived Fuel) |
| Fuel Flow Rate | 829 kg/h (to generate ~1 MW electricity) |
| Operating Temperature | 800°C – 1000°C |
| Operating Pressure | 5 bar (approximate) |
| Gasifier Diameter | 2.5 – 3.0 meters |
| Gasifier Height | 10 – 12 meters |
| Reactor Volume | 50 – 60 m³ |
| Lining Material | High-Alumina Refractory (90% Al₂O₃) |
| Outer Shell Material | Carbon Steel SA 516 Grade 70 |
| Syngas Composition | CO: 20–25%, H₂: 15–20%, CH₄: 5–10%, CO₂: 10–15% |
| Cold Gas Efficiency (CGE) | ~70% |
| Tar Content | < 2 g/Nm³ (with catalytic cracking) |
| Ash Content (Fuel) | ~5% |
| Bed Material | Inert sand or Ni-based catalyst |
| Vessel Thickness | 30–40 mm (ASME compliant) |
| Expected Syngas Flow | ~977 kg/h |
| Control Systems | Temperature/pressure sensors, ESD, PRV |
Table 1: Gasifier Technical Datasheet
The functional mechanism particularly of a CFB gasifier is based on a circulating loop system and comprises the reactor where the solid particles include the biomass feedstock, the bed material, and the catalyst (Khalid, 2023). This helps to maintain a good contact between gas and solid which results in the efficient conversion of the biomass into syngas with minimum amount of carbon being lost. The Ni-based catalyst used in bed was used to improve syngas quality in that it reduced the formation of tar while increasing the level of hydrogen in the product.
Besides its efficiency, the CFB gasifier can be used at small-scale or large-scale biomass power plants because of its scalability (Wu et al. 2023). Due to the characteristics of spatial distribution uniformity, no channeling, the continuous working mode, and an intensive working environment, it is the best choice for developing a 1 MW biomass gasification plant with high efficiency, fuel flexibility, and low emission.
Advantages
The Circulating Fluidized Bed (CFB) Gasifier for its ability to utilize a wide range of available fuels, energy efficiency, and comparatively low greenhouse emissions, CFB Gasifier is very suitable. The three aspects make it preferable over other types of gasification technologies to ensure the stability and sustainability of biomass power generation.
Fuel Flexibility
One of the advantages associated with the usage of a CFB gasifier is its flexibility to process various fuels of differing degrees of moisture content and particular sizes (Huang et al. 2025). While the type of biomass feedstocks can be more limited in other types of gasifiers such as the fixed-bed gasifier, a CFB gasifier can process:
Agricultural residues
High-moisture biomass (up to 60%) without significant loss of efficiency
Heterogeneous waste-derived fuels
This flexibility ensures CFB gasification is suitable for waste-to-energy since it will not heavily rely on the quality biomass to provide fuel.
High Efficiency
The efficiency of production of the gasification systems depends on the yield of the biomass to syngas and the extent of energy extraction. The CFB gasifier achieves:
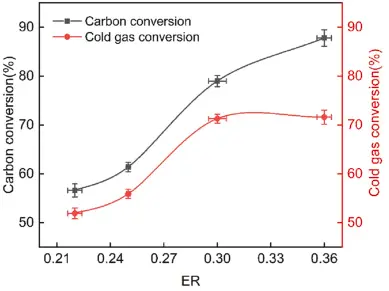
Figure 2: Carbon conversion
Higher carbon conversion efficiency ranges from 85–90% meaning that there is maximized extraction of energy from biomass (Khalid, 2023).
The heat transfer is better in this case as the particles are circulated continuously to bring uniform overall temperature distribution.
Less tar production³, enhancement in syngas quality and hence the reduction of the costs to carry out downstream purification (Njuguna, 2024).
Lower Emissions
One of the significant beneficial characteristics of CFB gasifiers is their environmental characteristic. In the common production of gasifiers, CFB has the following advantages:
Higher turbulence and uniformity of combustions also caused less tar and particulate emissions.
The NOx and the SOx formation are relatively low because the operating temperature is moderate, which is around 850 ° C.
Heat and Mass Balance Calculations
In terms of the performance of the Circulating Fluidized Bed (CFB) Gasifier operation and assessment, heat and mass balance calculations are used to obtain efficiency, syngas and thermal energy conversion rate (Kurkela et al. 2022). These allow for calculating the specifics of the gasifier aimed at producing 1 MW el from biomass fuel.
Gasifier Efficiency and Syngas Yield Analysis
The gasification efficiency is thus given by the ratio of the chemicals in the syngas generated to the amount of chemicals in the biomass fed to the system. It is calculated as:
ηgasifier=(Energy in Syngas Output/Energy in Biomass Input)×100
Thus for the 1 MW gasification plant required energy per hour is:
1MW=1000kW=3600MJ/h
The Lower Heating Value (LHV) of RDF biomass, which is obtained from the refused derived from public places, is around 15.5 MJ/kg (Golnahali, 2023). Based on the assumption that the efficiency of the gasifier is 90%, the mass flow rate of the biomass needed is:
Biomass Input=3600/15.5×0.9=259 kg/h
Therefore, it suggests that it is required to have about 259 kg of RDF biomass per hour for the production of 1 MW of electricity.
As the result can be derived from the earlier discussions, 85% of the carbon within RDF can be converted into syngas, thus an approximate yield of syngas is;
Syngas Output=100/85×Biomass Input=100/85×259=305 kg/h
The syngas normally contain:
- CO (20-25%)
- H₂ (15-20%)
- CH₄ (5-10%)
- CO₂ (10-15%)
- N₂ (30-40%)
Therefore, it is estimated that 305 kg/h of the syngas is produced and utilized in electricity generation using a gas turbine or an internal combustion engine.
Fuel Input-Output Ratio Calculations
The mass balance equation for a gasifier follows the conservation of mass principle:
Input Biomass+Air/Steam=Output Syngas+Char+Ash+Losses
Given:
- Biomass input = 259 kg/h
- Air/steam input ratio = 0.3-1
- Syngas output = 305 kg/h
- Char and ash residues = 10-12% of input biomass
The char and ash output is estimated as:
Char/Ash=0.12×259=31 kg/h
Thus, the approximate fuel mass balance is:
259 kg/h (Biomass) +78 kg/h (Steam/Air)=305 kg/h (Syngas)+31 kg/h (Char/Ash)
Thermal Energy Conversion Performance
The energy conversion efficiency (η_conversion) of the gasifier is determined based on the Cold Gas Efficiency (CGE) and thermal energy output:
ηconversion=(LHV of Syngas Output×Syngas Flow Rate/LHV of Biomass Input×Biomass Flow Rate) X 100
With a Cold Gas Efficiency (CGE) of 70%, the energy transferred to syngas is:
Syngas Energy Output=0.7×3600MJ/h=2520MJ/h
This syngas is then used in a gas engine with 40% efficiency, producing:
Electric Power Output=0.40×2520=1008MJ/h=0.28 MW
This result indicates that with the given assumptions, the gasifier alone is not sufficient to produce 1 MW of electricity (Bonci, 2021). To reach the target of 1 MW, either:
The efficiency of the gasifier needs to be improved, or
A higher biomass feed rate is required.
Let’s determine the required biomass input for exactly 1 MW of power:
Required Syngas Energy=3600/0.40=9000MJ/h
Since CGE = 70%, the biomass energy input needed is:
Biomass Energy Input=9000/0.70=12857MJ/h
The revised biomass flow rate is:
12857/15.5=829 kg/h
Thus, to achieve 1 MW output, 829 kg/h of RDF biomass is required instead of 259 kg/h.
Expected gas composition and performance
The major product in the Circulating Fluidized Bed (CFB) Gasifier is the syngas also known as synthetic gas which is used for electricity generation (Ortiz et al. 2021). This is because the characteristics of the feedstock used and the conditions of the gasification process such as temperature, the ratio of steam to biomass and the chemical reaction kinetics of the gasification process largely influence the composition of the syngas.
Expected Syngas Composition
The major components of the synthetic gas generated from the CFB gasifier operating at roughly 800 – 1000 °C are;
| Syngas Component | Expected Composition (% by volume) | Function |
|---|---|---|
| Carbon Monoxide (CO) | 20 - 25% | Main combustible gas; provides energy in the gas engine |
| Carbon Monoxide (CO) | 20 - 25% | Main combustible gas; provides energy in the gas engine |
| Hydrogen (H₂) | 15 - 20% | High-energy fuel component for combustion |
| Methane (CH₄) | 5 - 10% | Contributes to overall calorific value |
| Carbon Dioxide (CO₂) | 10 - 15% | Byproducts can be captured or used in CCUS processes |
| Nitrogen (N₂) | 30 - 40% | Inert gas; originates from the air used for gasification |
| Tar and Particulates | <2 g/Nm³ | Minimal due to high turbulence and catalyst presence |
Table 1: Performance Parameters
Among the parameters to assess the quality and performance of syngas, heating value, cold gas efficiency (CGE), and tar content are the most important.
Lower Heating Value (LHV):
The lower heating value of syngas varies from 4 to 6 MJ/Nm³, it depends on the fuel and gasification size of syngas.
The higher the CO and H₂ content, the higher the energy yield.
Cold Gas Efficiency (CGE):
The CGE of the CFB gasifier is 70%, which means 70% of biomass energy potential is realized as syngas energy (Amrullah and Oktaviananda, 2022).
Tar Content and Syngas Purity:
CFB gasifiers produce low tar of less than 2 g/Nm³ due to the low formation of tar after the gasification process.
Cracking of tars is beneficial with the Ni-based catalyst that also improves the quality of the resulting syngas and its production throughput.
Thermal energy input = 1 MW/0.22 = 4.54 MW = 4.5 X 3600 = 16,344 MJ/h.
IfLHV = 19.7 MJ/Kg,
Fuel flow rate = 16,344/19.7 = 829 Kg/h.
Syngas yield = 2Nm3/ kg biomass.
Syngas production rate: 1658 X 5 = 8290 MJ/h.
If residnce time is 600 sdecond,
Volume = biomass fuel rate X residence time/ bulk density = 829 X 600/400 X 3600 = 0.346 m3.
Height to diameter (H/D) ratio = 4:1
Let V = πr2h,
50 = πX D/2 D/ 2 X 4D
100/π= D3
or D = 3.17 m
Height = 4D = 12.7 m
3. Costing
3.1 Expenditures
3.1.1 Capital Expenditures (CAPEX)
The costs that are usually incurred for establishing a 1MW biomass gasification plant are as follows: The cost of the gasifier system, the cost of installation, the cost of auxiliary equipment and finally the cost of commissioning (Vuorela, 2023). These costs are very important in evaluating the possibility of the project as well as its sustainability in the long run.
Breakdown of CAPEX Costs
Approximately £15M for capital expenditures, the major parts of which include the following:
| CAPEX Component | Estimated Cost (£M) | Percentage of Total CAPEX |
|---|---|---|
| Gasifier Equipment | 5.0 | 33.3% |
| Power Generation Unit (Gas Engine/Turbine) | 2.0 | 13.3% |
| Heat Recovery and Cleaning Systems | 1.5 | 10.0% |
| Installation and Construction | 4.0 | 26.7% |
| Miscellaneous and Contingencies | 2.5 | 16.7% |
| Total CAPEX | 15.0 | 100% |
Table 2: Gasifier System Cost (£5M)
Circulating Fluidized Bed (CFB) Gasifier is the principal equipment in the gasification plant and it has the functionality of converting the biomass into the syngas. The £5M cost covers:
Reactor chamber
Bed material (Ni-based catalyst)
Gas-solid separation system
Syngas cooling and cleaning units
Structural and refractory materials
It is however costlier than many other models but it justifies this by having pre-eminent fuel flexibility, the highest efficiency ranging between 85-90 % and lower emissions than other models of gasifiers (Fratianni, 2023).
Installation and Infrastructure Costs (£4M)
Huge expenses for installation and infrastructures which are part of the total CAPEX reaching 26.7%.
Site riser and civil works (£1.2M) – These are structures of the building foundation, floor and the location of plant structures.
Piping and Instrumentation £1.5M – It involves connecting feedstock handling pipe works, the pipe works of the gasifier in as well as the utility pipelines.
Mechanical and Electrical Work (£1.3M) – This includes the wiring work, the motor controls and all the automation about the running of the gasifier.
Cost of Auxiliary Equipment (£3.5M)
Auxiliary equipment is important for the effective production of syngas and electricity. The estimated cost breakdown:
Power Generation Unit (£2M): This is another machine that is used to transform the generated syngas to electricity through the use of a gas engine or a gas turbine.
Heat Recovery and Gas Cleaning Systems (£1.5M): Composed of syngas cooling equipment, cyclone separators and tar elimination equipment that are required to cool the syngas after gasification, removing the tars which result from the gasification process (Krūmiņš and Kļaviņš, M., 2023).
They help raise the overall utilization ratio and reduce emissions in these systems.
Commissioning and Contingencies (£2.5M)
The last business activity of CAPEX includes:
Commissioning and Testing (£1.5M): The works include calibration, thorough safety checks and validation of the processes.
Miscellaneous and Contingencies (£1M): Unforeseen expenses such as minor design modifications and operational adjustments.
3.1.2 Operational Expenditures (OPEX)
The cost involved in the operation and maintenance of a 1 MW biomass gasification plant known as operational expenditures is important for the feasibility assessment of the project. It is composed of costs to be incurred in the day-to-day running of the gasification system including fuel costs, maintenance expenses, labour costs, utilities costs and other expenses (Miccio et al. 2021).
Breakdown of OPEX Costs
There are several OPEX factors for the 1 MW plant which amounts to £2.5M approximately and several of these are described below:
| OPEX Component | Annual Cost (£M) | Percentage of Total OPEX |
|---|---|---|
| Fuel Cost (RDF Biomass) | 1.0 | 40% |
| Labor Cost | 0.6 | 24% |
| Maintenance and Repair | 0.4 | 16% |
| Utilities and Energy Consumption | 0.5 | 20% |
| Insurance and Miscellaneous | 0.3 | 12% |
| Total OPEX | 2.5 | 100% |
Table 3: OPEX Costs
Fuel Cost (£1.0M per year)
The most significant operational expense is fuel procurement, as the plant relies on RDF biomass for gasification.
Daily RDF Biomass Requirement: 829 kg/h
Annual RDF Biomass Consumption: 829×24×365=7,263,960 kg/year
Average RDF Cost:£140 per ton
Total Fuel Cost: 7,264×140=1.02M≈1.0M (£ per year)
OPEX is further dependent on fuel which may fluctuate constantly with the amounts paid for the fuel supply; that is why long-term fuel supply contracts are important (Asni and Andiappan, 2021).
Labor Cost (£0.6M per year)
These are plant operating costs, engineers’ wages, safety personnel wages, and all other administrative expenses. The plant typically requires:
Operators and Engineers (10-12 personnel)
Administrative and Support Staff (5-6 personnel)
Security and Safety Staff (4-5 personnel)
The estimated labour cost of having employees of this team is £0.6M per year since each employee is paid an average of £40,000 per year.
Maintenance and Repair (£0.4M per year)
It is relatively healthy to carry out preventive and routine maintenance to minimize disruption in the plants. The major maintenance costs include:
Gasifier Refractory Lining Replacement (£0.15M)
Mechanical Wear and Tear Repairs (£0.10M)
Catalyst Replacement and Cleaning (£0.08M)
Unplanned Repairs and Emergency Costs (£0.07M)
It is an approach that prevents shocks and expenses related to repair and extension, which is crucial for the long-term use of a product.
Utilities and Energy Consumption (£0.5M per year)
As for the utilities, the gasification plant needs electricity supply, water and many others to support the process (Aguado et al. 2022). The estimated annual costs are:
Electricity Consumption (£0.25M) – Power needed for motors and pumps as well as the usage of instruments.
Water and Steam Requirements (£0.15M) – Water that is used for steam generation and cooling of syngas.
Miscellaneous Utilities (£0.10M) – Related consumable products including compressed air, cooling towers, ventilation systems, etc.
Insurance and Miscellaneous Costs (£0.3M per year)
Plant Insurance (£0.15M) – For damages to equipment, accidents and liability.
Regulatory Compliance (£0.10M) – Environmental permit, emissions testing, safety compliance.
Other Miscellaneous Costs (£0.05M) – Unforeseen expenses, minor repairs, and administrative costs.
Impact of Fuel Variations on Operating Expenses
Fuel Price Volatility
There are always changes in the costs of biomass fuel such as variations in price depending on the time of the year or the cost of transportation (Lynd et al. 2022).
If RDF prices increase by 10-20%, then the annual fuel cost may have an addition of £1.1M – £1.2M which may decrease profitability.
Feedstock Quality and Efficiency
Moisture content influences gasifier efficiency and the yield of syngas from RDF biomass (Penney et al. 2022).
Hence, the content of moisture more than 20% decreases the yield of syngas, thus increasing the consumption of the fuel and OPEX.
Alternative Feedstock Considerations
This amounts to about £ 250 000 worth of fuel and power consumption annually which forms the largest portion of the OPEX of £ 2.5 M. Controlling the supply of fuel, maintenance, and efficiency is key in controlling and maximizing the costs to increase the profitability of the biomass gasification plant.
3.2 Revenues
3.2.1 Capital Revenues
Capital revenues are funds that are usually from grants, subsidies, carbon credits or other forms of external funding required to finance the initial investment in the 1 MW biomass gasification plant (Gubin et al. 2024). These revenues are useful in partly financing the CAPEX as well as determining the financial viability of the project.
Key Capital Revenue Sources:
Government Grants and Subsidies (£3M - £5M)
Biomass power plants are subsidized by several governments for renewable energy.
Carbon Credits and Emission Trading (£1M - £2M)
This is because biomass gasification has been proven to decrease the output of CO₂, and carbon credits can be sold for revenue.
In terms of the estimated level of CO₂ emission reduction, the initiative can make £10 to £20 per ton of CO₂ offset.
Private Investments and Loans (£5M - £7M)
Equity funding from financiers targeting the new and renewable energy business.
Credit facilities at a low interest from green financing institutions.
3.2.2 Operational Revenues
The operational revenues are regarded as the amount of income received in generating revenues during the production of the plant (Lo et al. 2021). Besides, the primary sources of income include:
Electricity Sales (£5.5M per year)
If the biomass plant is to operate continuously, then it will generate approximately more than 8,760 MWh in a year.
Selling electricity at £0.63/kWh results in:
1,000kW×24h×365×0.63=£5.5M per year
Byproduct Sales (£0.5M per year)
Char residue can be used in agriculture or for energy (£200,000 per annum).
Product Sales: It is possible to sell the captured CO₂ for industrial use worth £ 300,000 per year.
Renewable Energy Incentives (£1M per year)
Feed-in Tariff (FiT) and Renewable Energy Certificates (REC) form the ingredient additional revenue (Adhiguna, 2021).
3.3 Financial Analysis
The financial feasibility of the 1 MW biomass gasification plant is determined by its payback period, cost-benefit analysis, and long-term sustainability.
Payback Period Calculation
The total CAPEX for the project is £15M, and the annual operational revenue is £7M. The payback period is calculated as:
Payback Period=Total CAPEX/Annual Net Revenue
Given an OPEX of £2.5M per year, the annual net profit is:
Annual Net Revenue=7M−2.5M=4.5M
Thus, the payback period is:
15M/4.5M≈3.3 years
This short payback period indicates that the project is financially possible.
4. Sensitivity analysis and optimization
4.1 HAZOP Strategy
Approach to Hazard Identification
Evaluating hazards arise from high-temperature syngas, the flow of bed material and CO emissions (Mocellin et al. 2022).
Minimizing cases of gas leaks, explosions and fire risks.
The HAZOP methodology involves:
Defining study nodes (critical areas such as fuel input, gasifier reaction chamber, and syngas output).
Identifying possible variations abided by using guide words such as high, low, more, less, reverse, no flow or an unintended response.
Industry-Standard Safety Practices
To reduce the level of risks involved in biomass gasification, some precautionary measures and safety policies are incorporated during the process.
Gasifier Safety Controls
Temperature Control Systems: The reactor temperature should range between 800-1000°C to avoid excessive formation of ash slagging as well as excessive temperature inside the reactor.
Pressure Relief Valves (PRVs): Prevent over-pressurization in the gasifier and syngas pipelines (Esiri et al. 2024).
Syngas Handling and Explosion Prevention
Electrical Instrumentation: CO, H2, and CH4 leakage identification to avoid explosive situations.
Emergency Shutdown System (ESD)
Fire suppression systems (CO₂ or dry chemical) protect combustion zones.
4.2 HAZOP Scope
Some of the risks associated with the Circulating Fluidized Bed (CFB) Gasifier include high operating temperatures and pressure levels.
Risk Analysis Based on Gasifier Operation
Gasifier operation involves potential safety risks and therefore a structure risk analysis is done to assess the safety consequences of the operation. The first are the absolute risks:
Syngas Composition and Toxicity
Carbon monoxide (CO) supplier and hydrogen (H₂) are both components of syngas that are flammable and toxic (Imron et al. 2022).
Mitigation: Gas leak detection sensors, proper ventilation systems, and shutdown mechanisms whenever there is an occurrence of gas leakages.
Tar Formation and Fouling
This is because high tar content may cause blockage in the pipeline as well as fouling of equipment.
Mitigation: Use of Ni-based catalysts, hot gas filtration, and cyclone separators.
Potential Process Hazards and Risk Categories
The risks can be divided into three main classes of hazards.
| Risk Type | Potential Hazards | Mitigation Measures |
|---|---|---|
| Process Safety Hazards | Gas leaks, over-pressurization, thermal runaway | Automated controls, pressure relief valves, emergency shutdown system |
| Health and Environmental Hazards | CO poisoning, particulate emissions, NOx/SOx emissions | Gas monitoring, PPE for workers, emission control units |
| Operational Hazards | Equipment wear, feedstock variability, syngas fluctuations | Preventive maintenance, real-time monitoring, and fuel pre-treatment (Middha et al. 2024). |
Table 4: Hazards and Mitigation
4.3 Base Assumptions
HAZOP study needs a set of base assumptions to minimize the variations as well as enhance the effective development of the risk evaluation. These assumptions cover operational conditions, system constraints, and critical safety parameters within the 1 MW Circulating Fluidized Bed (CFB) Gasifier plant.
Operational Assumptions for Risk Assessment
Continuous Operation
The gasifier is in continuous operation for 24 hours in steady mode, although it sometimes goes through short-term maintenance.
The fuel feed rate is kept to about 829 kg per hour to ensure the production of the 1MW of electricity.
Gasification Efficiency and Syngas Quality
Cold Gas Efficiency (CGE): 70%
Syngas Composition:
CO: 20-25%
H₂: 15-20%
CH₄: 5-10%
CO₂: 10-15%
The gasifier will produce 85% carbon conversion into syngas, the total tar content is less than 2 g/Nm³.
Environmental and Regulatory Compliance
Transportation of CO₂ and similar fluids through the plant environment.
Critical Safety Parameters
Temperature and Pressure Control
Service temperature: 800-1000° C (with stable thermal regime to avoid sticking of the productive layer and material destruction).
Emergency Shutdown (ESD) System
Personal and Equipment Safety
Employees use PPE (flame-resistant clothing, gas masks, gloves).
CO₂ and dry powder extinguishers for fire suppression are available.
4.4 Reference Drawings and Study Nodes
Process Flow Diagram (PFD)
Outlines the biomass-to-syngas conversion process.
It concerns pre-treatment systems, gasification systems, syngas cooling and cleaning systems.
It also checks the safe sequence of operation and verifies the balance in the energy flow.
Aspen Process Flow Simulation Diagram
It also contains detailed mass and energy balance values for steady-state analysis of the process.
Helps to locate the areas where the temperature and pressure changes are likely to occur and be critical.
Block Flow Diagram and Syngas Conditioning Units
Indicates that it is involved in the processes of gas cleaning and conditioning through the use of the cyclone separator, the gas scrubbers and heat exchangers.
Highlights safety-critical areas for potential gas leaks and explosion hazards.
Study Nodes for HAZOP
Fuel Feed System: There is a high chance of blockages and backflow and variations in the rate of feed.
Gasifier Chamber: high temperatures lead to overheating, buildup of slag and pressure (Pawlaa et al. 2024).
Syngas Output and Cleaning: specific risks may include the formation of TAR, thereby affecting the quality of the product and leakage of the gas to the environment.
4.5 HAZOP Study Record
| Study Node | Deviation | Possible Cause | Consequences | Mitigation Measures |
|---|---|---|---|---|
| Fuel Feed System | No flow | Blockage in biomass feeder | Loss of gas production | Automated feed monitoring, backup feed system |
| Gasifier Chamber | High temperature | Excessive oxygen, inadequate cooling | Overheating, slagging, equipment damage | Temperature sensors, cooling system |
| Syngas Output | High pressure | Blockage in pipeline | Gas leak, explosion risk | Pressure relief valves (PRVs), regular inspections |
| Gas Cleaning System | Tar buildup | Incomplete cracking, low temperature | Pipe fouling, reduced efficiency | Catalyst use, temperature control, and cleaning cycles (Peck, 2022). |
Table 5: HAZOP Study Record
4.6 Hazard Study Actions and Conclusions
Keeping customers safe with aiding policies like OSHA, ISO 45001, and EU environmental policies and procedures.
Key mitigation measures include:
Monitoring and control of temperature and pressures to avoid the effects of high temperature and pressures.
Projections in improving syngas filtration and tar elimination for high efficiency in the process.
Emergency Shutdown Systems (ESD) are capable of alarms to incorporate safety mechanisms throughout the plant.
4.6.1 Updated P&ID with New Safeguards
The P&ID for the gasifier system is changed to improve the overall safety and add extra levels of safety in the modification. The modifications include:
Temperature and Pressure Sensors
Extra high-temperature alarms in the gasifier chamber which is set at 1000 °C (Curl, 2023).
Safety relief valves are located at the output of syngas lines to ensure that the pressure level does not go beyond normal levels.
Automated Gas Leak Detection
Catalytic combustion analyzers for CO and H₂ are used to be placed in the syngas pipeline and the reactor zone.
Alarm-triggered ventilation system for rapid gas dispersal.
Emergency Shutdown Systems (ESD)
ALL the triggers that cause auto safety shut down are as follows:
Temperature exceeding 1000°C
Gas leaks detected above 10% Lower Explosive Limit (LEL)
Syngas Cleaning and Filtration Improvements
The nickel-based catalyst is improved to crack more tar and have less risk of fouling.
These enhanced P&ID help to improve risks and enhance the effectiveness of plant operations thereby minimizing the risks of catastrophic failures.
4.6.2 Hazard List of Actions
In the HAZOP study, the following are the actions to be followed to safeguard and minimize operation risk:
Fuel Feed System Safety Measures
Automated biomass feeder monitoring should be installed primarily to address the problem of blockage (Li, 2021).
Ensure that the company has standby fuel sources as a contingency measure to ensure that it carries on with the operation when the main source is exhausted.
Gasifier Chamber Overheat Prevention
Increase the efficiency of the cooling system through water/steam injection whenever temperatures are higher.
Thermal sensors installation.
Process Automation and Emergency Protocols
Temperature, pressure and gas leak alarms were provided through electric safety interlocks.
Simulated emergency shutdowns for operational personnel of organisations and establishments.
Regular Maintenance and Safety Inspections
Perform maintenance on the integrity of the gasifier chamber once every two months.
Change the catalyst materials at least once every 6 to 12 months to enhance the rate of elimination of the tar content.
4.6.3 Discussion on Hazard Control Measures
Risk management is an effective strategy to be adopted in the process. The primary risks include high-temperature processes, syngas emissions, and feedstock fluctuation; appropriate measures have to be put in place to address the safety issues (Wang et al. 2023).
Process Automation and Real-Time Monitoring
Operation fluctuations through the use of automated temperature and pressure systems.
Continuous monitoring of the syngas composition is useful for checking the process objectives compliance.
Structural and Material Enhancements
There is an upgrading of the refractory material to avoid severe heat damage in the gasifier.
Material strength of the pipeline to withstand situations that may lead to leakage as well as fluctuations in pressure.
Human Safety and Training
Safety drills to make the workers to be prepared all the time in case of emergency incidents.
Usage of personal protective equipment and the process of categorizing hazardous areas also minimize the exposure risks.
5. Conclusion
The CFB gasifier is for the 1 MW biomass gasification plant is due to fuel flexibility, high efficiency, and low emissions of pollutants. The heat and mass balance approve that 829 kg/h of RDF biomass is needed to feed the engine to generate constant power and syngas.
The plant shows good economic viability; capital cost is estimated to be £15M and annual operating cost £2.5M. The payback period analysis (3.3 years) looks quite promising for biomass energy thus confirming that biomass is a resourceful investment.
All these are accompanied by measures identified by HAZOP that help in achieving a risk-free working environment including; automated detection of gas leakage, added pressure relief systems and mechanisms for shutdown of the system in emergencies.
Struggling to manage complex coursework or technical assignments? online assignment help offers reliable academic support tailored to university students’ needs. With expert guidance, clear explanations, and well-structured solutions, Native Assignment Help helps you understand your subject better while meeting academic standards and deadlines with confidence.
Reference List
Journals
- Adhiguna, P., 2021. Indonesia’s Biomass Cofiring Bet. Jakarta Improving the Quality of Agricultural Wastes for Solid Fuels Employing, 387.
- Aguado, R., Vera, D., Jurado, F. and Beltrán, G., 2022. An integrated gasification plant for electric power generation from wet biomass: toward a sustainable production in the olive oil industry. Biomass Conversion and Biorefinery, pp.1-20.
- Amrullah, S. and Oktaviananda, C., 2022. Effect of Air Fuel Ratio to Quality of Municipal Solid Waste Using Downdraft Gasification. REM (Rekayasa Energi Manufaktur) Jurnal, 7(1), pp.27-34.
- Asni, T. and Andiappan, V., 2021. Optimal design of biomass combined heat and power system using fuzzy multi-objective optimisation: considering system flexibility, reliability, and cost. Process Integration and Optimization for Sustainability, 5, pp.207-229.
- Bonci, M., 2021. Fuel Cell Vehicle simulation: an approach based on Toyota Mirai (Doctoral dissertation, Politecnico di Torino).
- Curl, C.R., 2023. Integrating small-scale wood gasifier-generator systems and natural gas-powered combined heat and power systems: technological, economic, and environmental perspectives.
- Esiri, A.E., Jambol, D.D. and Ozowe, C., 2024. Best practices and innovations in carbon capture and storage (CCS) for effective CO2 storage. International Journal of Applied Research in Social Sciences, 6(6), pp.1227-1243.
- Fratianni, N., 2023. Oxygen-blown gasification of sewage sludge and biomass for chemicals synthesis.
- Golnahali, A., 2023. Steam treatment of SRF and its impact on contaminant concentration and fuel properties.
- Gubin, V., Benedikt, F., Thelen, F., Hammerschmid, M., Popov, T., Hofbauer, H. and Müller, S., 2024. Hydrogen production from woody biomass gasification: a techno‐economic analysis. Biofuels, Bioproducts and Biorefining, 18(4), pp.818-836.
- Huang, X., Bai, Z., Zhu, X., Wang, S., Mu, L. and Gong, L., 2025. Gas-Solid Flow, Combustion Characteristics, and Gas Emissions in a 75 t/h CFB Boiler Based on the CPFD Method. Journal of Thermal Science, 34(1), pp.323-336.
- Imron, R., Suyitno, S., Ilyas, A.X., Faishal, A., Budiono, A. and Yusuf, M., 2022. Producing hydrogen-rich syngas via microwave heating and co-gasification: a systematic review. Biofuel Research Journal, 9(1), pp.1573-1591.
- Khalid, F., 2023. Analysis of air and oxyfuel combustion based CFB biomass power plants.
- Krūmiņš, J. and Kļaviņš, M., 2023. Integrated Circulating Fluidized Bed Gasification System for Sustainable Municipal Solid Waste Management: Energy Production and Heat Recovery. Energies, 16(13), p.5203.
- Kurkela, E., Kurkela, M. and Tuomi, S., 2022. Development of a bubbling circulating fluidized-bed reactor for biomass and waste gasification. Chemical Engineering Transactions, 92, pp.385-390.
- Li, Y., 2021. Deep Learning based Prediction of Clogging Occurrences during Lignocellulosic Biomass Feeding in Screw Conveyors.
- Liu, X., Zhang, M., Zhang, S., Ding, Y., Huang, Z., Zhou, T., Yang, H. and Yue, G., 2022. Measuring technologies for CFB solid circulation rate: a review and future perspectives. Energies, 15(2), p.417.
- Lo, S.L.Y., How, B.S., Teng, S.Y., Lam, H.L., Lim, C.H., Rhamdhani, M.A. and Sunarso, J., 2021. Stochastic techno-economic evaluation model for biomass supply chain: A biomass gasification case study with supply chain uncertainties. Renewable and Sustainable Energy Reviews, 152, p.111644.
- Lynd, L.R., Beckham, G.T., Guss, A.M., Jayakody, L.N., Karp, E.M., Maranas, C., McCormick, R.L., Amador-Noguez, D., Bomble, Y.J., Davison, B.H. and Foster, C., 2022. Toward low-cost biological and hybrid biological/catalytic conversion of cellulosic biomass to fuels. Energy and Environmental Science, 15(3), pp.938-990.
- Miccio, F., Raganati, F., Ammendola, P., Okasha, F. and Miccio, M., 2021. Fluidized bed combustion and gasification of fossil and renewable slurry fuels. Energies, 14(22), p.7766.
- Middha, R., Srivastava, N. and Saxena, N., 2024. Chemical Principles in Waste Segregation and Recycling. In Waste Management for Smart Cities (pp. 1-46). Singapore: Springer Nature Singapore.
- Mocellin, P., De Tommaso, J., Vianello, C., Maschio, G., Saulnier‐Bellemare, T., Virla, L.D. and Patience, G.S., 2022. Experimental methods in chemical engineering: Hazard and operability analysis—HAZOP. The Canadian Journal of Chemical Engineering, 100(12), pp.3450-3469.
- Njuguna, F.I., 2024. Numerical Study for the Design of a Fluidized Bed Reactor for Biomass Gasification (Doctoral dissertation, JKUAT-CoETEC).
- Pawlaa, V.K., Kumara, S. and Kumarb, S., 2024. Enhancing Resistance to Corrosion, Erosion and Oxidation of Boiler Steels by Surface Modification Techniques. Journal of Materials, 2(3), pp.157-169.
- Peck, D., 2022. Biomass Gasification Syngas Cleanup: Development of a Novel Nickel-Ceramic Filter for Reforming of Tar Model Compound, Naphthalene. University of Louisiana at Lafayette.
- Penney, T.K., Nahil, M.A. and Williams, P.T., 2022. Pyrolysis-catalytic steam/dry reforming of processed municipal solid waste for control of syngas H2: CO ratio. Journal of the Energy Institute, 102, pp.128-142.
- Silva Ortiz, P., Maier, S., Dietrich, R.U., Pinto Mariano, A., Maciel Filho, R. and Posada, J., 2021. Comparative techno-economic and exergetic analysis of circulating and dual bed biomass gasification systems. Frontiers in Chemical Engineering, 3, p.727068.
- Vuorela, J., 2023. A profitability of the gasification plant in proportion to power consumption of a lime kiln.
- Wang, B., Gupta, R., Bei, L., Wan, Q. and Sun, L., 2023. A review on gasification of municipal solid waste (MSW): Syngas production, tar formation, mineral transformation and industrial challenges. International Journal of Hydrogen Energy, 48(69), pp.26676-26706.
- Wu, Z., Liang, X., Liang, D. and Huang, Z., 2023. CO2 Capture from Biomass Gasification Current Technologies, Challenges and Future Prospects. Academic Journal of Science and Technology, 7(1), pp.206-212.
Go Through the Best and FREE Samples Written by Our Academic Experts!
Native Assignment Help. (2026). Retrieved from:
https://www.nativeassignmenthelp.co.uk/ems600-integrated-chemical-engineering-design-project-46033
Native Assignment Help, (2026),
https://www.nativeassignmenthelp.co.uk/ems600-integrated-chemical-engineering-design-project-46033
Native Assignment Help (2026) [Online]. Retrieved from:
https://www.nativeassignmenthelp.co.uk/ems600-integrated-chemical-engineering-design-project-46033
Native Assignment Help. (Native Assignment Help, 2026)
https://www.nativeassignmenthelp.co.uk/ems600-integrated-chemical-engineering-design-project-46033
- FreeDownload - 39 TimesSubstance Use Disorders in Young Adults: A Health and Social Care Perspective Assignment
Introduction Nature/Extent of the problem or issue Substance use/abuse within...View or download
- FreeDownload - 40 TimesAssessments of education and training assignment example
INTRODUCTION: Assessment Assignment Examples The learning process is...View or download
- FreeDownload - 41 TimesMedication Administration Assessment Sample
Medication Administration For Dementia Patient Using Driscoll's...View or download
- FreeDownload - 39 TimesBSS057-6 Corporate Innovation And Entrepreneurship Assignment Example
Introduction - BSS057-6 Corporate Innovation And Entrepreneurship The...View or download
- FreeDownload - 43 TimesSoftware Process Models Assignment Sample
Software Process Models Assignments Task 1 To successfully design and...View or download
- FreeDownload - 40 TimesStrategic Role of DMOs in Sustainable Tourism Development Assignment
An Analytical Evaluation of the Strategic Role of DMOs in Sustainable Global...View or download
-
100% Confidential
Your personal details and order information are kept completely private with our strict confidentiality policy.
-
On-Time Delivery
Receive your assignment exactly within the promised deadline—no delays, ever.
-
Native British Writers
Get your work crafted by highly-skilled native UK writers with strong academic expertise.
-
A+ Quality Assignments
We deliver top-notch, well-researched, and perfectly structured assignments to help you secure the highest grades.

